
Advertisement
- United States
- /
- Food
- /
- NYSE:K
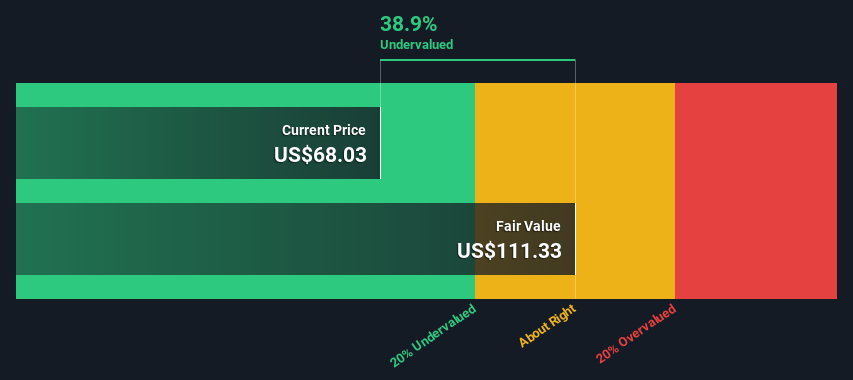
An Intrinsic Calculation For Kellogg Company (NYSE:K) Suggests It's 39% Undervalued

Key Insights
- Using the 2 Stage Free Cash Flow to Equity, Kellogg fair value estimate is US$111
- Kellogg's US$68.03 share price signals that it might be 39% undervalued
- Our fair value estimate is 53% higher than Kellogg's analyst price target of US$72.74
Today we'll do a simple run through of a valuation method used to estimate the attractiveness of Kellogg Company (NYSE:K) as an investment opportunity by estimating the company's future cash flows and discounting them to their present value. We will take advantage of the Discounted Cash Flow (DCF) model for this purpose. There's really not all that much to it, even though it might appear quite complex.
We generally believe that a company's value is the present value of all of the cash it will generate in the future. However, a DCF is just one valuation metric among many, and it is not without flaws. If you still have some burning questions about this type of valuation, take a look at the Simply Wall St analysis model.
View our latest analysis for Kellogg
The Model
We use what is known as a 2-stage model, which simply means we have two different periods of growth rates for the company's cash flows. Generally the first stage is higher growth, and the second stage is a lower growth phase. To begin with, we have to get estimates of the next ten years of cash flows. Where possible we use analyst estimates, but when these aren't available we extrapolate the previous free cash flow (FCF) from the last estimate or reported value. We assume companies with shrinking free cash flow will slow their rate of shrinkage, and that companies with growing free cash flow will see their growth rate slow, over this period. We do this to reflect that growth tends to slow more in the early years than it does in later years.
Generally we assume that a dollar today is more valuable than a dollar in the future, and so the sum of these future cash flows is then discounted to today's value:
10-year free cash flow (FCF) forecast
| 2023 | 2024 | 2025 | 2026 | 2027 | 2028 | 2029 | 2030 | 2031 | 2032 | |
| Levered FCF ($, Millions) | US$1.22b | US$1.28b | US$1.37b | US$1.72b | US$1.87b | US$1.99b | US$2.09b | US$2.17b | US$2.25b | US$2.32b |
| Growth Rate Estimate Source | Analyst x5 | Analyst x5 | Analyst x4 | Analyst x1 | Analyst x1 | Est @ 6.18% | Est @ 4.95% | Est @ 4.09% | Est @ 3.48% | Est @ 3.06% |
| Present Value ($, Millions) Discounted @ 6.8% | US$1.1k | US$1.1k | US$1.1k | US$1.3k | US$1.3k | US$1.3k | US$1.3k | US$1.3k | US$1.2k | US$1.2k |
("Est" = FCF growth rate estimated by Simply Wall St)
Present Value of 10-year Cash Flow (PVCF) = US$12b
We now need to calculate the Terminal Value, which accounts for all the future cash flows after this ten year period. The Gordon Growth formula is used to calculate Terminal Value at a future annual growth rate equal to the 5-year average of the 10-year government bond yield of 2.1%. We discount the terminal cash flows to today's value at a cost of equity of 6.8%.
Terminal Value (TV)= FCF2032 × (1 + g) ÷ (r – g) = US$2.3b× (1 + 2.1%) ÷ (6.8%– 2.1%) = US$50b
Present Value of Terminal Value (PVTV)= TV / (1 + r)10= US$50b÷ ( 1 + 6.8%)10= US$26b
The total value is the sum of cash flows for the next ten years plus the discounted terminal value, which results in the Total Equity Value, which in this case is US$38b. The last step is to then divide the equity value by the number of shares outstanding. Compared to the current share price of US$68.0, the company appears quite good value at a 39% discount to where the stock price trades currently. The assumptions in any calculation have a big impact on the valuation, so it is better to view this as a rough estimate, not precise down to the last cent.
The Assumptions
We would point out that the most important inputs to a discounted cash flow are the discount rate and of course the actual cash flows. Part of investing is coming up with your own evaluation of a company's future performance, so try the calculation yourself and check your own assumptions. The DCF also does not consider the possible cyclicality of an industry, or a company's future capital requirements, so it does not give a full picture of a company's potential performance. Given that we are looking at Kellogg as potential shareholders, the cost of equity is used as the discount rate, rather than the cost of capital (or weighted average cost of capital, WACC) which accounts for debt. In this calculation we've used 6.8%, which is based on a levered beta of 0.800. Beta is a measure of a stock's volatility, compared to the market as a whole. We get our beta from the industry average beta of globally comparable companies, with an imposed limit between 0.8 and 2.0, which is a reasonable range for a stable business.
SWOT Analysis for Kellogg
Strength
- Debt is well covered by earnings and cashflows.
- Dividends are covered by earnings and cash flows.
Weakness
- Earnings declined over the past year.
- Dividend is low compared to the top 25% of dividend payers in the Food market.
Opportunity
- Annual earnings are forecast to grow for the next 3 years.
- Trading below our estimate of fair value by more than 20%.
Threat
- Annual earnings are forecast to grow slower than the American market.
Looking Ahead:
Valuation is only one side of the coin in terms of building your investment thesis, and it shouldn't be the only metric you look at when researching a company. DCF models are not the be-all and end-all of investment valuation. Preferably you'd apply different cases and assumptions and see how they would impact the company's valuation. For instance, if the terminal value growth rate is adjusted slightly, it can dramatically alter the overall result. Can we work out why the company is trading at a discount to intrinsic value? For Kellogg, there are three essential items you should assess:
- Risks: You should be aware of the 3 warning signs for Kellogg we've uncovered before considering an investment in the company.
- Management:Have insiders been ramping up their shares to take advantage of the market's sentiment for K's future outlook? Check out our management and board analysis with insights on CEO compensation and governance factors.
- Other High Quality Alternatives: Do you like a good all-rounder? Explore our interactive list of high quality stocks to get an idea of what else is out there you may be missing!
PS. The Simply Wall St app conducts a discounted cash flow valuation for every stock on the NYSE every day. If you want to find the calculation for other stocks just search here.
Valuation is complex, but we're here to simplify it.
Discover if Kellanova might be undervalued or overvalued with our detailed analysis, featuring fair value estimates, potential risks, dividends, insider trades, and its financial condition.
Access Free AnalysisHave feedback on this article? Concerned about the content? Get in touch with us directly. Alternatively, email editorial-team (at) simplywallst.com.
This article by Simply Wall St is general in nature. We provide commentary based on historical data and analyst forecasts only using an unbiased methodology and our articles are not intended to be financial advice. It does not constitute a recommendation to buy or sell any stock, and does not take account of your objectives, or your financial situation. We aim to bring you long-term focused analysis driven by fundamental data. Note that our analysis may not factor in the latest price-sensitive company announcements or qualitative material. Simply Wall St has no position in any stocks mentioned.
About NYSE:K
Kellanova
Manufactures and markets snacks and convenience foods in North America, Europe, Latin America, the Asia Pacific, the Middle East, Australia, and Africa.
Established dividend payer with proven track record.
Similar Companies
Market Insights


Advertisement
Community Narratives
Rocket Lab USA Will Ignite a 30% Revenue Growth Journey
Fair Value US$31.72|41.9% undervalued
KI
Community Contributor
EasyJet weirdly unloved by investors in spite of relatively attractive metrics
Fair Value UK£6.95|31.9% undervalued
PI
Community Contributor
HEXPOL AB: Sustained Long Term Growth, Stable Margins, and Strategic M&A
Fair Value SEK 122.27|24.9% undervalued
MA
Community Contributor