Advertisement
- United States
- /
- Food
- /
- NYSE:GIS
Evaluating General Mills Shares After 25% Drop and Weak 2025 Guidance

Simply Wall St
Reviewed by Bailey Pemberton
Thinking about what to do with General Mills stock? You are hardly alone. The share price has been on a bit of a rollercoaster this year, with some investors shaken by changing market sentiment around consumer staples. After a recent dip, General Mills closed at $47.74, representing a 4.0% drop over the past week and a staggering 24.9% loss since the start of the year. Even the longer view feels choppy: the stock is down 29.7% for the past twelve months and 31.8% over three years. The five-year mark stands at a still-sizable 6.9% decline.
Market watchers point to shifting consumer preferences and broader sector rotation as explanations for these moves, with investors sometimes sliding out of defensive staples in search of higher-octane opportunities elsewhere. The bigger question, though, is whether General Mills has actually become undervalued after this selloff.
When we run the numbers, General Mills looks attractively priced by most metrics. In fact, the company checks the box on 5 out of 6 key undervaluation measures. That is a value score of 5 that should catch the eye of any bargain hunter.
But before you decide whether to buy, hold, or move on, it is worth digging into the nuts and bolts behind those numbers. In the next section, we will break down the main valuation methods investors rely on to gauge whether a stock is a deal or a dud. After that, I will share an even more insightful approach that could help you see General Mills in a whole new light.
Why General Mills is lagging behind its peers
Approach 1: General Mills Discounted Cash Flow (DCF) Analysis
A Discounted Cash Flow (DCF) model estimates what a company is worth today by projecting its future cash flows and then discounting those amounts back to the present using a rate that covers risk and the time value of money. This method helps investors understand what a business might truly be worth, beyond just current earnings or dividends.
For General Mills, the DCF analysis uses a 2 Stage Free Cash Flow to Equity method. The company’s current Free Cash Flow is $2.01 billion, and analyst estimates project continued growth over the coming years. By 2029, Free Cash Flow is forecast to reach $2.29 billion. While analysts supply estimates through 2029, Simply Wall St extrapolates further into the future to complete the ten-year outlook. This means later figures are forward estimates based on trends rather than direct analyst predictions.
After running this projection and discounting back to today's dollars, the model arrives at an intrinsic value of $101.85 per share for General Mills. With the shares currently trading at $47.74, this implies the stock is trading at a 53.1% discount to its calculated fair value. In other words, General Mills appears significantly undervalued according to standard DCF metrics.
Result: UNDERVALUED
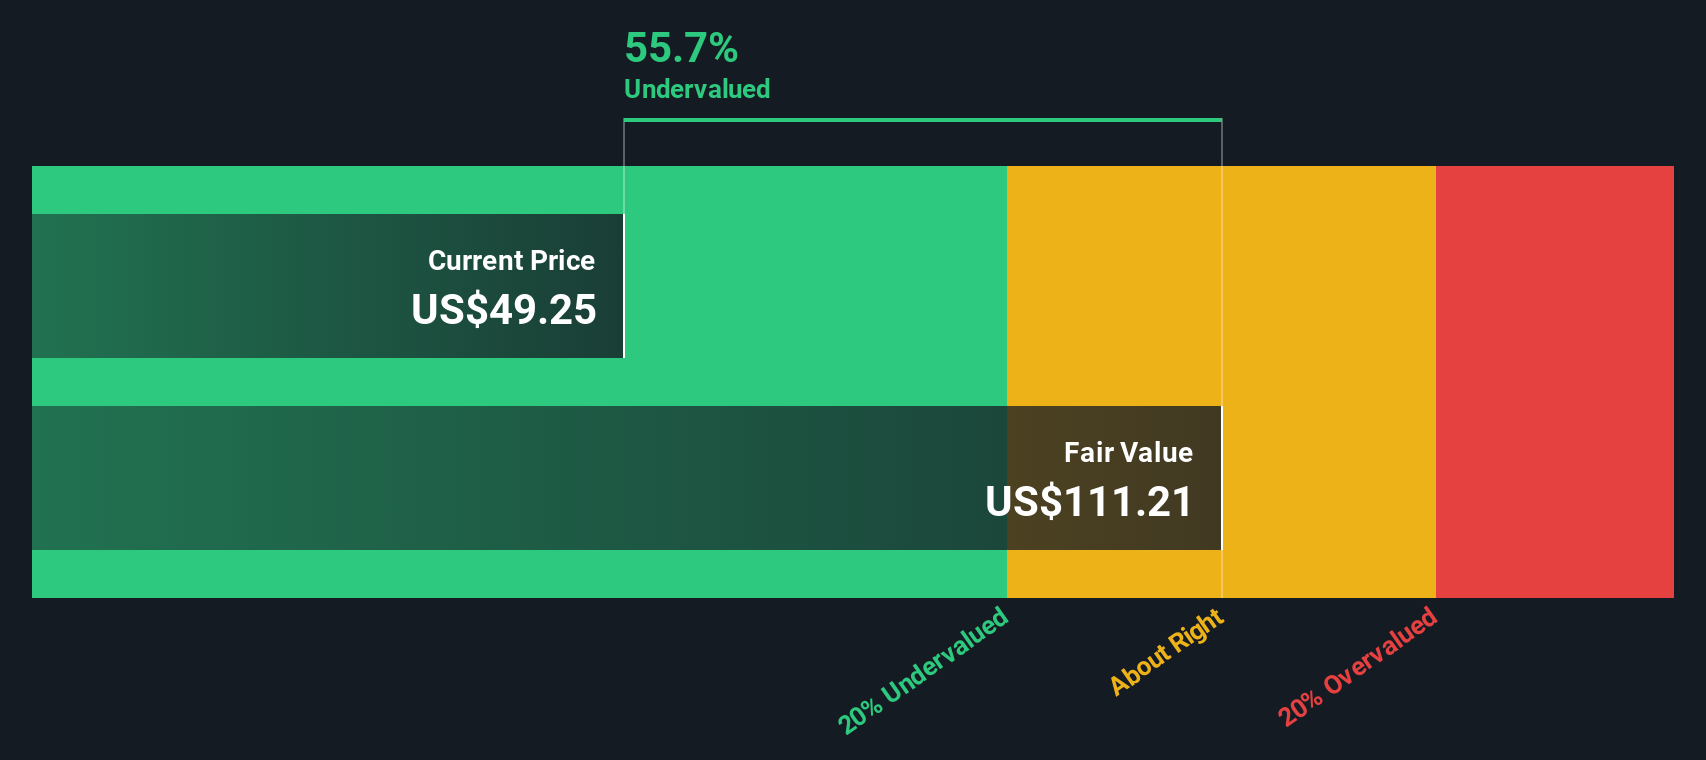
Our Discounted Cash Flow (DCF) analysis suggests General Mills is undervalued by 53.1%. Track this in your watchlist or portfolio, or discover more undervalued stocks.
Approach 2: General Mills Price vs Earnings (PE)
The Price-to-Earnings (PE) ratio is one of the most reliable ways to value profitable companies like General Mills because it relates a company’s market price to its actual earnings. Profitable and stable firms are best evaluated using PE, as it reflects the earnings power investors are paying for. Of course, growth expectations and risks play a big role in what counts as “normal.” Higher growth and lower risk typically justify higher PE ratios, while slower growth or greater uncertainty point to a lower PE being reasonable.
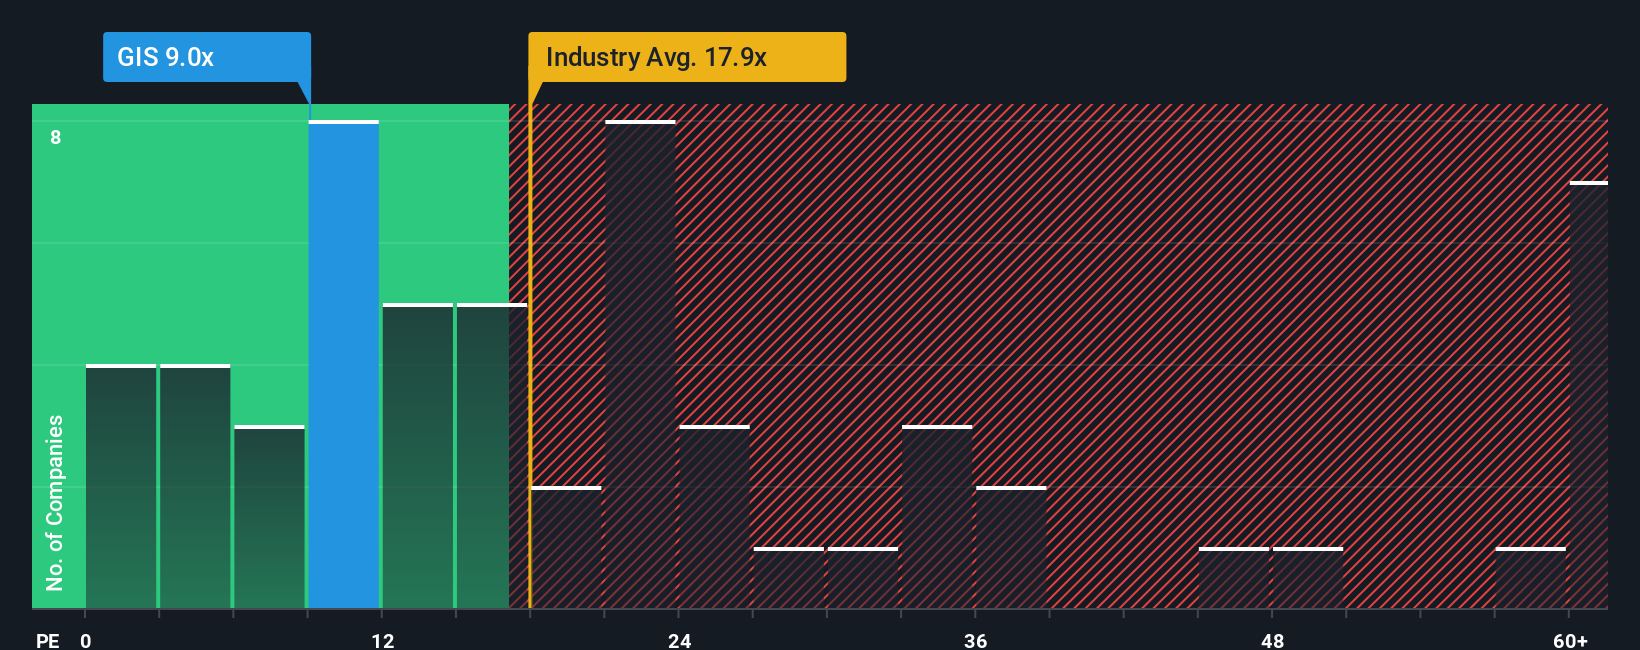
General Mills currently trades at a PE ratio of 8.75x. This is well below the food industry average of 17.91x and far under the peer group average of 23.36x. At face value, the market is pricing General Mills at a significant discount to both its industry and peers.
However, Simply Wall St’s proprietary Fair Ratio for General Mills stands at 12.16x. This Fair Ratio goes beyond simple comparisons by factoring in the company’s specific earnings growth, profit margins, industry dynamics, size, and risk profile. It provides a clearer baseline for fair value than industry or peer averages alone. Since General Mills’ current PE of 8.75x is considerably below its Fair Ratio, it suggests the stock is meaningfully undervalued on this measure.
Result: UNDERVALUED
PE ratios tell one story, but what if the real opportunity lies elsewhere? Discover companies where insiders are betting big on explosive growth.
Upgrade Your Decision Making: Choose your General Mills Narrative
Earlier we mentioned that there is an even better way to understand valuation, so let us introduce you to Narratives. A Narrative is your story and perspective on a company like General Mills, linking what you believe about its future (such as revenue, earnings, and margins) to a financial forecast and ultimately a fair value estimate. Narratives let you move beyond the static numbers, providing context about why you think a stock is undervalued or overvalued, and making your reasoning visible and shareable in the Simply Wall St Community page, which is used by millions of investors globally.
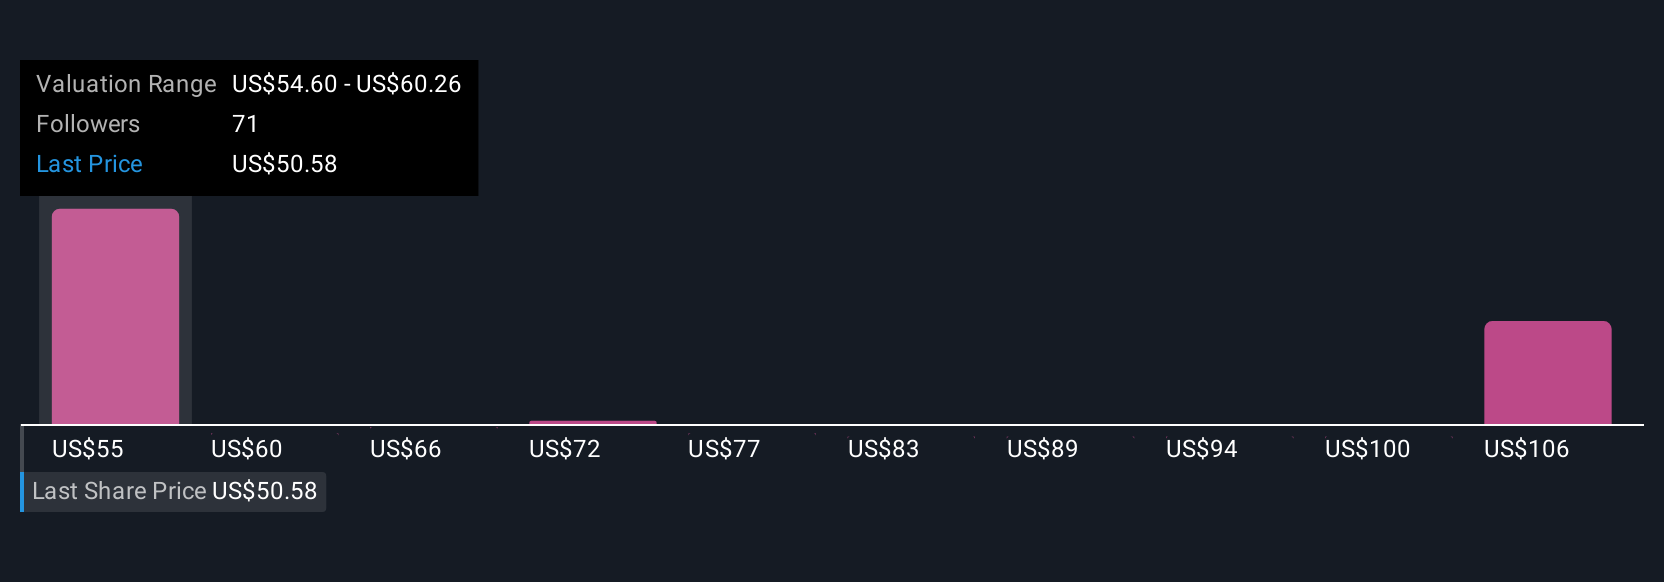
With Narratives, you can see how your view compares to others and make smarter buy or sell decisions by measuring your Fair Value against the actual share price. Narratives are updated dynamically whenever fresh news, earnings reports, or sector trends emerge, keeping your outlook relevant. For example, some investors believe General Mills’ focus on innovation and cost-saving reinvestment will drive earnings growth and justify a fair value as high as $63.00 per share, while others think near-term challenges and shrinking margins suggest a fair value closer to $45.00. In short, Narratives empower you to connect the story, the numbers, and your actions, giving you a smarter, more dynamic way to invest.
Do you think there's more to the story for General Mills? Create your own Narrative to let the Community know!
This article by Simply Wall St is general in nature. We provide commentary based on historical data and analyst forecasts only using an unbiased methodology and our articles are not intended to be financial advice. It does not constitute a recommendation to buy or sell any stock, and does not take account of your objectives, or your financial situation. We aim to bring you long-term focused analysis driven by fundamental data. Note that our analysis may not factor in the latest price-sensitive company announcements or qualitative material. Simply Wall St has no position in any stocks mentioned.
New: Manage All Your Stock Portfolios in One Place
We've created the ultimate portfolio companion for stock investors, and it's free.
• Connect an unlimited number of Portfolios and see your total in one currency
• Be alerted to new Warning Signs or Risks via email or mobile
• Track the Fair Value of your stocks
Have feedback on this article? Concerned about the content? Get in touch with us directly. Alternatively, email editorial-team@simplywallst.com
About NYSE:GIS
6 star dividend payer and undervalued.
Similar Companies
Market Insights

Advertisement
Community Narratives
A formidable player in AI and enterprise computing.
Fair Value US$210.00|11.7% overvalued
CO
Community Contributor
IREN's Bold Moves in Sustainable Bitcoin Mining & AI Data Centers
Fair Value US$89.00|23.6% undervalued
BL
Community Contributor
Cooling the Champions: The Aussie Tech Behind F1's Victories
Fair Value AU$12.40|37.6% undervalued
TR
Community Contributor