
Advertisement
- United States
- /
- Food
- /
- NasdaqGS:PPC
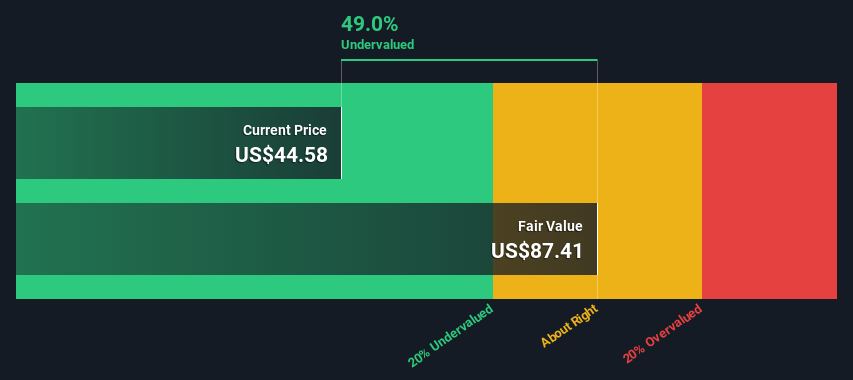
Pilgrim's Pride Corporation (NASDAQ:PPC) Shares Could Be 49% Below Their Intrinsic Value Estimate
Key Insights
- The projected fair value for Pilgrim's Pride is US$87.41 based on 2 Stage Free Cash Flow to Equity
- Pilgrim's Pride is estimated to be 49% undervalued based on current share price of US$44.58
- The US$42.50 analyst price target for PPC is 51% less than our estimate of fair value
In this article we are going to estimate the intrinsic value of Pilgrim's Pride Corporation (NASDAQ:PPC) by taking the expected future cash flows and discounting them to today's value. Our analysis will employ the Discounted Cash Flow (DCF) model. It may sound complicated, but actually it is quite simple!
We generally believe that a company's value is the present value of all of the cash it will generate in the future. However, a DCF is just one valuation metric among many, and it is not without flaws. Anyone interested in learning a bit more about intrinsic value should have a read of the Simply Wall St analysis model.
Check out our latest analysis for Pilgrim's Pride
The Calculation
We use what is known as a 2-stage model, which simply means we have two different periods of growth rates for the company's cash flows. Generally the first stage is higher growth, and the second stage is a lower growth phase. In the first stage we need to estimate the cash flows to the business over the next ten years. Where possible we use analyst estimates, but when these aren't available we extrapolate the previous free cash flow (FCF) from the last estimate or reported value. We assume companies with shrinking free cash flow will slow their rate of shrinkage, and that companies with growing free cash flow will see their growth rate slow, over this period. We do this to reflect that growth tends to slow more in the early years than it does in later years.
A DCF is all about the idea that a dollar in the future is less valuable than a dollar today, so we discount the value of these future cash flows to their estimated value in today's dollars:
10-year free cash flow (FCF) forecast
| 2025 | 2026 | 2027 | 2028 | 2029 | 2030 | 2031 | 2032 | 2033 | 2034 | |
| Levered FCF ($, Millions) | US$476.8m | US$726.2m | US$820.9m | US$803.5m | US$798.4m | US$800.9m | US$808.6m | US$820.2m | US$834.5m | US$851.0m |
| Growth Rate Estimate Source | Analyst x2 | Analyst x1 | Analyst x1 | Analyst x1 | Est @ -0.63% | Est @ 0.31% | Est @ 0.97% | Est @ 1.43% | Est @ 1.75% | Est @ 1.97% |
| Present Value ($, Millions) Discounted @ 5.8% | US$451 | US$649 | US$693 | US$641 | US$602 | US$571 | US$545 | US$523 | US$503 | US$484 |
("Est" = FCF growth rate estimated by Simply Wall St)
Present Value of 10-year Cash Flow (PVCF) = US$5.7b
After calculating the present value of future cash flows in the initial 10-year period, we need to calculate the Terminal Value, which accounts for all future cash flows beyond the first stage. The Gordon Growth formula is used to calculate Terminal Value at a future annual growth rate equal to the 5-year average of the 10-year government bond yield of 2.5%. We discount the terminal cash flows to today's value at a cost of equity of 5.8%.
Terminal Value (TV)= FCF2034 × (1 + g) ÷ (r – g) = US$851m× (1 + 2.5%) ÷ (5.8%– 2.5%) = US$26b
Present Value of Terminal Value (PVTV)= TV / (1 + r)10= US$26b÷ ( 1 + 5.8%)10= US$15b
The total value is the sum of cash flows for the next ten years plus the discounted terminal value, which results in the Total Equity Value, which in this case is US$21b. To get the intrinsic value per share, we divide this by the total number of shares outstanding. Compared to the current share price of US$44.6, the company appears quite good value at a 49% discount to where the stock price trades currently. Valuations are imprecise instruments though, rather like a telescope - move a few degrees and end up in a different galaxy. Do keep this in mind.
Important Assumptions
Now the most important inputs to a discounted cash flow are the discount rate, and of course, the actual cash flows. Part of investing is coming up with your own evaluation of a company's future performance, so try the calculation yourself and check your own assumptions. The DCF also does not consider the possible cyclicality of an industry, or a company's future capital requirements, so it does not give a full picture of a company's potential performance. Given that we are looking at Pilgrim's Pride as potential shareholders, the cost of equity is used as the discount rate, rather than the cost of capital (or weighted average cost of capital, WACC) which accounts for debt. In this calculation we've used 5.8%, which is based on a levered beta of 0.800. Beta is a measure of a stock's volatility, compared to the market as a whole. We get our beta from the industry average beta of globally comparable companies, with an imposed limit between 0.8 and 2.0, which is a reasonable range for a stable business.
SWOT Analysis for Pilgrim's Pride
Strength
- Earnings growth over the past year exceeded the industry.
- Debt is well covered by earnings and cashflows.
Weakness
- No major weaknesses identified for PPC.
Opportunity
- Good value based on P/E ratio and estimated fair value.
Threat
- Annual earnings are forecast to decline for the next 3 years.
Looking Ahead:
Valuation is only one side of the coin in terms of building your investment thesis, and it ideally won't be the sole piece of analysis you scrutinize for a company. DCF models are not the be-all and end-all of investment valuation. Instead the best use for a DCF model is to test certain assumptions and theories to see if they would lead to the company being undervalued or overvalued. For example, changes in the company's cost of equity or the risk free rate can significantly impact the valuation. Can we work out why the company is trading at a discount to intrinsic value? For Pilgrim's Pride, we've compiled three additional factors you should consider:
- Risks: Case in point, we've spotted 3 warning signs for Pilgrim's Pride you should be aware of, and 1 of them can't be ignored.
- Future Earnings: How does PPC's growth rate compare to its peers and the wider market? Dig deeper into the analyst consensus number for the upcoming years by interacting with our free analyst growth expectation chart.
- Other High Quality Alternatives: Do you like a good all-rounder? Explore our interactive list of high quality stocks to get an idea of what else is out there you may be missing!
PS. The Simply Wall St app conducts a discounted cash flow valuation for every stock on the NASDAQGS every day. If you want to find the calculation for other stocks just search here.
New: Manage All Your Stock Portfolios in One Place
We've created the ultimate portfolio companion for stock investors, and it's free.
• Connect an unlimited number of Portfolios and see your total in one currency
• Be alerted to new Warning Signs or Risks via email or mobile
• Track the Fair Value of your stocks
Have feedback on this article? Concerned about the content? Get in touch with us directly. Alternatively, email editorial-team (at) simplywallst.com.
This article by Simply Wall St is general in nature. We provide commentary based on historical data and analyst forecasts only using an unbiased methodology and our articles are not intended to be financial advice. It does not constitute a recommendation to buy or sell any stock, and does not take account of your objectives, or your financial situation. We aim to bring you long-term focused analysis driven by fundamental data. Note that our analysis may not factor in the latest price-sensitive company announcements or qualitative material. Simply Wall St has no position in any stocks mentioned.
About NasdaqGS:PPC
Pilgrim's Pride
Produces, processes, markets, and distributes fresh, frozen, and value-added chicken and pork products to retailers, distributors, and foodservice operators in the United States, Europe, and Mexico.
Outstanding track record and undervalued.
Similar Companies
Market Insights

Advertisement
Community Narratives
America Wants Homegrown Drones — Draganfly Is Ready to Deliver
Fair Value US$9.21|32.6% undervalued
JO
Community Contributor
Cheesecake Factory offers an enticing opportunity for long-term growth by leveraging new concepts
Fair Value US$73.83|25.6% undervalued
ZW
Community Contributor
Coca-Cola’s Intrinsic Value Set to Rise with Fed Rate Cut
Fair Value US$67.50|1.6% undervalued
AL
Community Contributor
Fully Permitted Gold Mine with 50 Baggers Potential 
Fair Value CA$41.00|98.2% undervalued
RO
Community Contributor