Advertisement
- United States
- /
- Oil and Gas
- /
- NYSE:RRC
Assessing Range Resources After a 450% Five Year Surge in Share Price

Simply Wall St
Reviewed by Bailey Pemberton
- Wondering if Range Resources is still a smart buy after its massive multi year run, or if most of the upside is already priced in? In this article, we break down what the market is really paying for.
- The stock has cooled off recently, down 6.0% over the last week and 4.1% over the past month, but it is still up 3.4% year to date, 4.4% over 1 year, 42.9% over 3 years, and an eye catching 450.2% over 5 years.
- Those moves sit against a backdrop of ongoing shifts in US natural gas demand, pipeline capacity debates, and investor rotation between cyclicals and defensives. Together, these themes are shaping how the market is re rating gas producers like Range Resources and what multiple investors are willing to pay.
- On our framework, Range Resources scores a solid 4/6 valuation checks, suggesting pockets of undervaluation that a headline price chart will not show. Next, we will walk through those different valuation lenses before finishing with an even more intuitive way to think about what the stock may be worth.
Approach 1: Range Resources Discounted Cash Flow (DCF) Analysis
A Discounted Cash Flow model estimates what a company is worth by projecting the cash it can return to shareholders in the future, then discounting those dollars back to today.
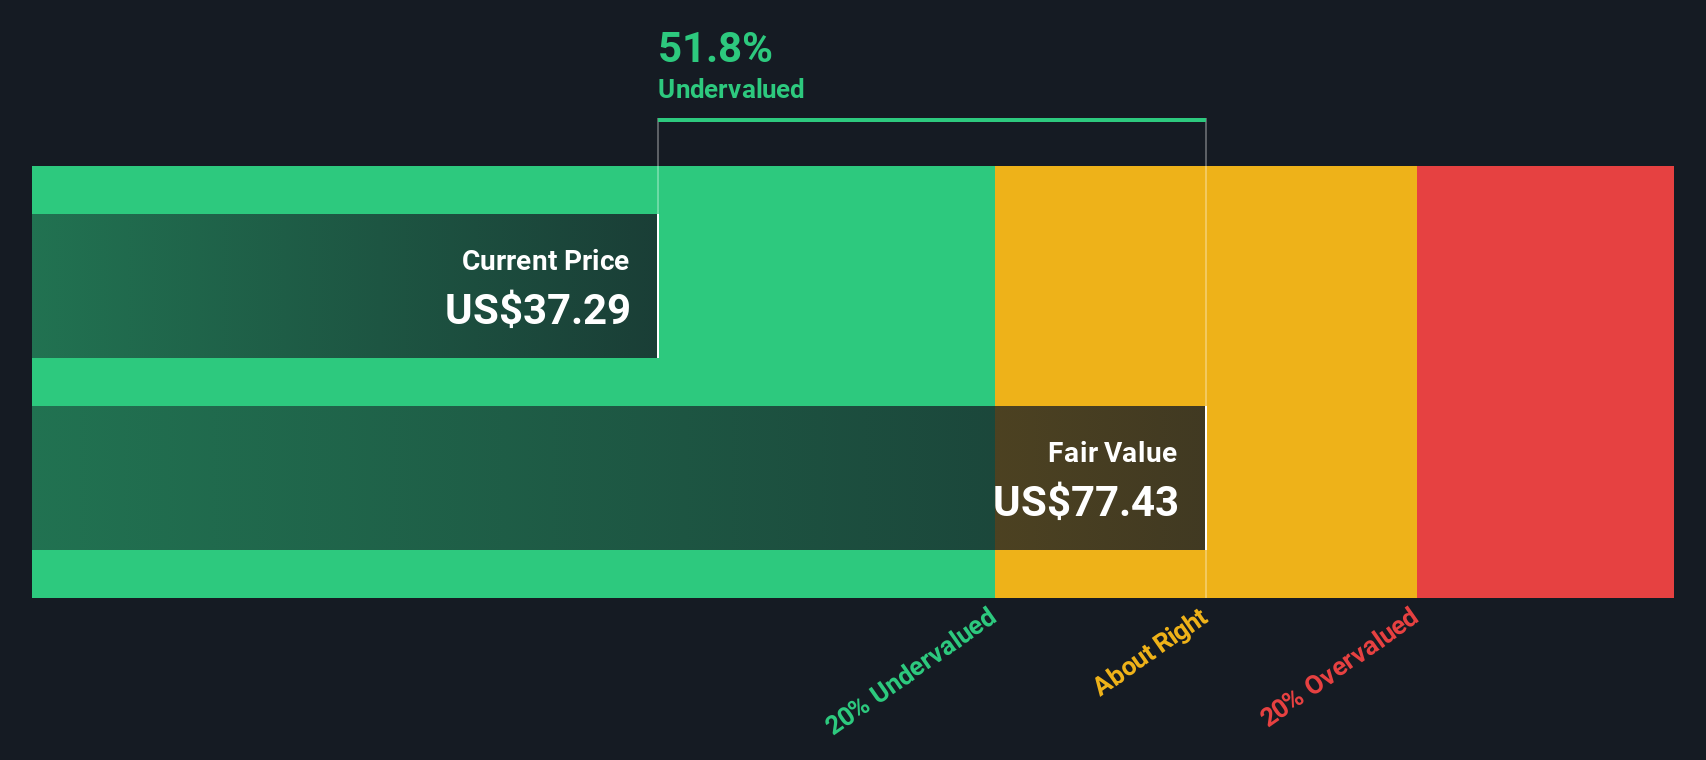
For Range Resources, the latest twelve month Free Cash Flow is about $492.5 Million. Analysts and extrapolated estimates see Free Cash Flow rising to around $872.7 Million by 2035, based on a 2 Stage Free Cash Flow to Equity model that blends near term analyst forecasts with longer term, slowing growth assumptions generated by Simply Wall St.
When all those projected cash flows are discounted back to today, the model arrives at an intrinsic value of roughly $77.43 per share. Compared with the current market price, this implies the stock is trading at a 51.8% discount to its estimated fair value. This suggests the market is pricing in a far more pessimistic future than the cash flow outlook implies.
Result: UNDERVALUED
Our Discounted Cash Flow (DCF) analysis suggests Range Resources is undervalued by 51.8%. Track this in your watchlist or portfolio, or discover 905 more undervalued stocks based on cash flows.
Approach 2: Range Resources Price vs Earnings
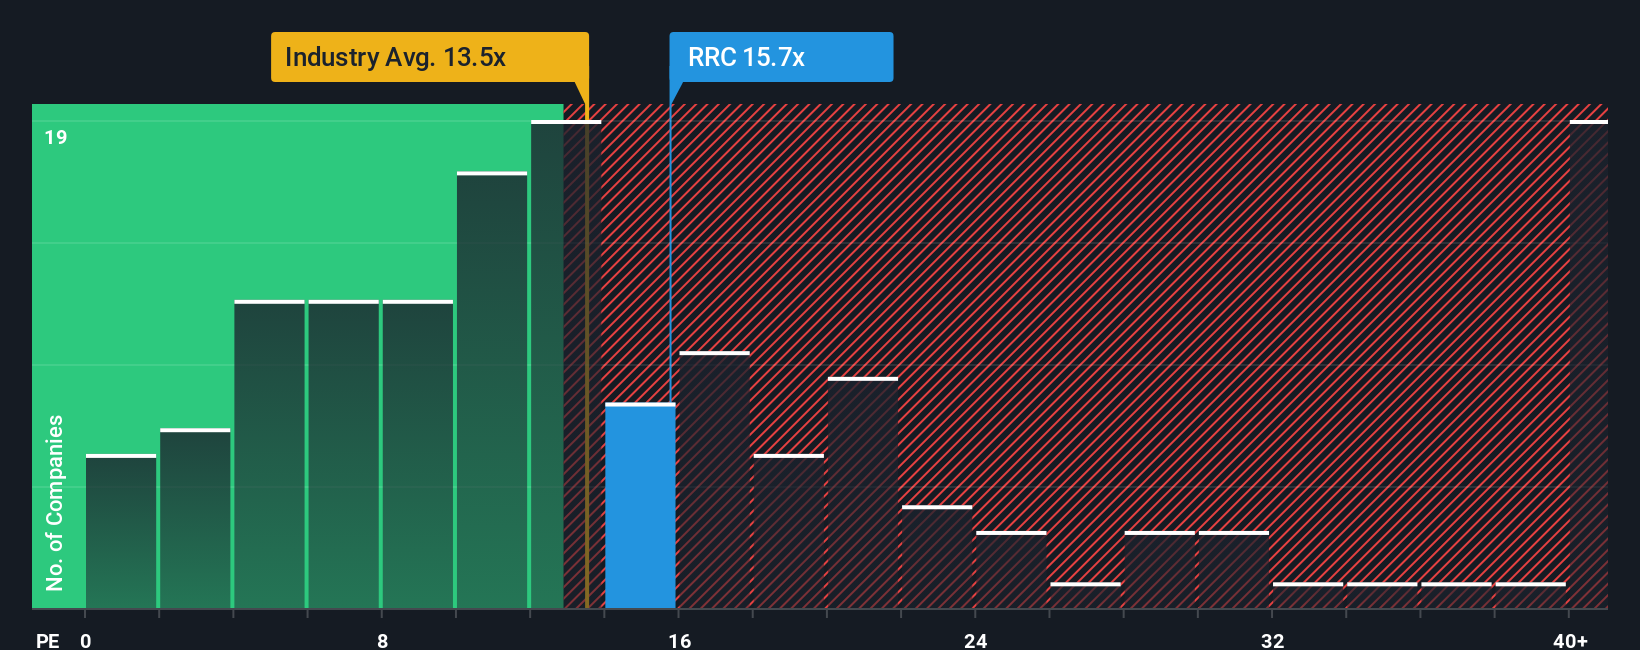
For a profitable producer like Range Resources, the Price to Earnings (PE) ratio is a practical way to gauge what investors are paying for each dollar of current earnings. In general, companies with stronger growth prospects and lower perceived risk often trade on higher, or more generous, PE multiples, while slower or riskier businesses usually trade on lower multiples.
Range Resources currently trades on about 15.4x earnings. That is slightly above the broader Oil and Gas industry average of around 13.5x, but well below the roughly 45.9x average of its peer group, where a few high growth names push the mean higher. To cut through that noise, Simply Wall St uses a proprietary “Fair Ratio” model. This model estimates what PE multiple a company could trade on given its earnings growth outlook, profitability, industry, market cap, and specific risks.
Because this Fair Ratio of about 18.8x is tailored to Range Resources own profile, it is more informative than a simple peer or sector comparison. With the current PE of 15.4x sitting below that Fair Ratio, the shares appear undervalued on this metric.
Result: UNDERVALUED
PE ratios tell one story, but what if the real opportunity lies elsewhere? Discover 1448 companies where insiders are betting big on explosive growth.
Upgrade Your Decision Making: Choose your Range Resources Narrative
Earlier we mentioned that there is an even better way to understand valuation, so let us introduce Narratives, a simple framework on Simply Wall St’s Community page that lets you attach your own story about Range Resources to the numbers by linking what you believe about its future revenue, earnings, and margins to a concrete forecast and fair value. You can then compare that fair value to today’s price to decide whether to buy or sell. Each Narrative updates dynamically as new news or earnings arrive and reflects the fact that some investors currently see fair value closer to the most bullish target of about $50 per share, while others anchor nearer the most bearish view around $28. All of this is provided within an easy to use tool that millions of investors already rely on.
Do you think there's more to the story for Range Resources? Head over to our Community to see what others are saying!
This article by Simply Wall St is general in nature. We provide commentary based on historical data and analyst forecasts only using an unbiased methodology and our articles are not intended to be financial advice. It does not constitute a recommendation to buy or sell any stock, and does not take account of your objectives, or your financial situation. We aim to bring you long-term focused analysis driven by fundamental data. Note that our analysis may not factor in the latest price-sensitive company announcements or qualitative material. Simply Wall St has no position in any stocks mentioned.
New: AI Stock Screener & Alerts
Our new AI Stock Screener scans the market every day to uncover opportunities.
• Dividend Powerhouses (3%+ Yield)
• Undervalued Small Caps with Insider Buying
• High growth Tech and AI Companies
Or build your own from over 50 metrics.
Have feedback on this article? Concerned about the content? Get in touch with us directly. Alternatively, email editorial-team@simplywallst.com
About NYSE:RRC
Range Resources
Operates as an independent natural gas, natural gas liquids (NGLs), and oil company in the United States.
Good value with adequate balance sheet.
Similar Companies
Market Insights

Advertisement
Weekly Picks
WO

woodworthfund on MGP Ingredients ·
THE KINGDOM OF BROWN GOODS: WHY MGPI IS BEING CRUSHED BY INVENTORY & PRIMED FOR RESURRECTION
Fair Value:US$4034.1% undervalued
16 followersusers have followed this narrative
1 commentusers have commented on this narrative
4 likesusers have liked this narrative
DO


Double_Bubbler on Vertical Aerospace ·
Why Vertical Aerospace (NYSE: EVTL) is Worth Possibly Over 13x its Current Price
Fair Value:US$6090.0% undervalued
21 followersusers have followed this narrative
1 commentusers have commented on this narrative
17 likesusers have liked this narrative
TI


TickerTickle on Oracle ·
The Quiet Giant That Became AI’s Power Grid
Fair Value:US$389.8142.8% undervalued
32 followersusers have followed this narrative
3 commentsusers have commented on this narrative
8 likesusers have liked this narrative
Recently Updated Narratives
MA


MarkoVT on ANYCOLOR ·
Near zero debt, Japan centric focus provides future growth
Fair Value:JP¥7.11k18.9% undervalued
1 followerusers have followed this narrative
0 commentsusers have commented on this narrative
0 likesusers have liked this narrative
LE

lexdrew1 on Corning ·
Corning's Revenue Will Climb by 12.73% in Just Five Years
Fair Value:US$108.6313.3% undervalued
1 followerusers have followed this narrative
0 commentsusers have commented on this narrative
0 likesusers have liked this narrative
LE

lexdrew1 on GE Vernova ·
GE Vernova revenue will grow by 13% with a future PE of 64.7x
Fair Value:US$824.5712.3% undervalued
8 followersusers have followed this narrative
0 commentsusers have commented on this narrative
0 likesusers have liked this narrative
Popular Narratives
TH


TheWallstreetKing on MicroVision ·
MicroVision will explode future revenue by 380.37% with a vision towards success
Fair Value:US$6098.5% undervalued
119 followersusers have followed this narrative
11 commentsusers have commented on this narrative
22 likesusers have liked this narrative
AN


AnalystConsensusTarget on NVIDIA ·
NVDA: Expanding AI Demand Will Drive Major Data Center Investments Through 2026
Fair Value:US$250.3926.6% undervalued
963 followersusers have followed this narrative
6 commentsusers have commented on this narrative
25 likesusers have liked this narrative
RO


RockeTeller on Santacruz Silver Mining ·
Crazy Undervalued 42 Baggers Silver Play (Active & Running Mine)
Fair Value:CA$8688.6% undervalued
76 followersusers have followed this narrative
8 commentsusers have commented on this narrative
21 likesusers have liked this narrative
