- United States
- /
- Oil and Gas
- /
- NYSE:OXY
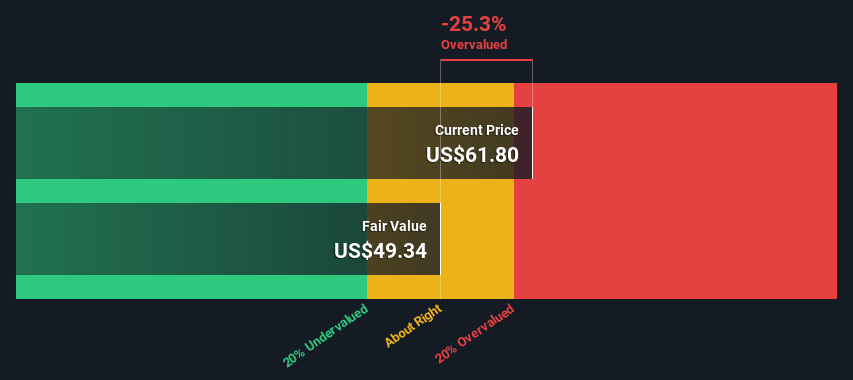
Is Occidental Petroleum Corporation (NYSE:OXY) Worth US$61.8 Based On Its Intrinsic Value?


Today we will run through one way of estimating the intrinsic value of Occidental Petroleum Corporation (NYSE:OXY) by taking the forecast future cash flows of the company and discounting them back to today's value. Our analysis will employ the Discounted Cash Flow (DCF) model. It may sound complicated, but actually it is quite simple!
We would caution that there are many ways of valuing a company and, like the DCF, each technique has advantages and disadvantages in certain scenarios. If you still have some burning questions about this type of valuation, take a look at the Simply Wall St analysis model.
See our latest analysis for Occidental Petroleum
What's The Estimated Valuation?
We use what is known as a 2-stage model, which simply means we have two different periods of growth rates for the company's cash flows. Generally the first stage is higher growth, and the second stage is a lower growth phase. To begin with, we have to get estimates of the next ten years of cash flows. Where possible we use analyst estimates, but when these aren't available we extrapolate the previous free cash flow (FCF) from the last estimate or reported value. We assume companies with shrinking free cash flow will slow their rate of shrinkage, and that companies with growing free cash flow will see their growth rate slow, over this period. We do this to reflect that growth tends to slow more in the early years than it does in later years.
A DCF is all about the idea that a dollar in the future is less valuable than a dollar today, so we need to discount the sum of these future cash flows to arrive at a present value estimate:
10-year free cash flow (FCF) forecast
| 2023 | 2024 | 2025 | 2026 | 2027 | 2028 | 2029 | 2030 | 2031 | 2032 | |
| Levered FCF ($, Millions) | US$10.2b | US$7.41b | US$3.25b | US$3.12b | US$3.06b | US$3.03b | US$3.03b | US$3.05b | US$3.08b | US$3.12b |
| Growth Rate Estimate Source | Analyst x6 | Analyst x4 | Analyst x1 | Analyst x1 | Est @ -2.04% | Est @ -0.83% | Est @ 0.01% | Est @ 0.60% | Est @ 1.02% | Est @ 1.31% |
| Present Value ($, Millions) Discounted @ 9.9% | US$9.3k | US$6.1k | US$2.4k | US$2.1k | US$1.9k | US$1.7k | US$1.6k | US$1.4k | US$1.3k | US$1.2k |
("Est" = FCF growth rate estimated by Simply Wall St)
Present Value of 10-year Cash Flow (PVCF) = US$29b
We now need to calculate the Terminal Value, which accounts for all the future cash flows after this ten year period. The Gordon Growth formula is used to calculate Terminal Value at a future annual growth rate equal to the 5-year average of the 10-year government bond yield of 2.0%. We discount the terminal cash flows to today's value at a cost of equity of 9.9%.
Terminal Value (TV)= FCF2032 × (1 + g) ÷ (r – g) = US$3.1b× (1 + 2.0%) ÷ (9.9%– 2.0%) = US$40b
Present Value of Terminal Value (PVTV)= TV / (1 + r)10= US$40b÷ ( 1 + 9.9%)10= US$16b
The total value, or equity value, is then the sum of the present value of the future cash flows, which in this case is US$45b. To get the intrinsic value per share, we divide this by the total number of shares outstanding. Compared to the current share price of US$61.8, the company appears slightly overvalued at the time of writing. Valuations are imprecise instruments though, rather like a telescope - move a few degrees and end up in a different galaxy. Do keep this in mind.
Important Assumptions
The calculation above is very dependent on two assumptions. The first is the discount rate and the other is the cash flows. You don't have to agree with these inputs, I recommend redoing the calculations yourself and playing with them. The DCF also does not consider the possible cyclicality of an industry, or a company's future capital requirements, so it does not give a full picture of a company's potential performance. Given that we are looking at Occidental Petroleum as potential shareholders, the cost of equity is used as the discount rate, rather than the cost of capital (or weighted average cost of capital, WACC) which accounts for debt. In this calculation we've used 9.9%, which is based on a levered beta of 1.427. Beta is a measure of a stock's volatility, compared to the market as a whole. We get our beta from the industry average beta of globally comparable companies, with an imposed limit between 0.8 and 2.0, which is a reasonable range for a stable business.
SWOT Analysis for Occidental Petroleum
- Debt is well covered by earnings and cashflows.
- Dividend is low compared to the top 25% of dividend payers in the Oil and Gas market.
- Expensive based on P/E ratio and estimated fair value.
- OXY's financial characteristics indicate limited near-term opportunities for shareholders.
- Annual earnings are forecast to decline for the next 3 years.
Moving On:
Whilst important, the DCF calculation ideally won't be the sole piece of analysis you scrutinize for a company. The DCF model is not a perfect stock valuation tool. Rather it should be seen as a guide to "what assumptions need to be true for this stock to be under/overvalued?" If a company grows at a different rate, or if its cost of equity or risk free rate changes sharply, the output can look very different. Why is the intrinsic value lower than the current share price? For Occidental Petroleum, we've put together three fundamental elements you should explore:
- Risks: We feel that you should assess the 2 warning signs for Occidental Petroleum (1 is a bit concerning!) we've flagged before making an investment in the company.
- Future Earnings: How does OXY's growth rate compare to its peers and the wider market? Dig deeper into the analyst consensus number for the upcoming years by interacting with our free analyst growth expectation chart.
- Other High Quality Alternatives: Do you like a good all-rounder? Explore our interactive list of high quality stocks to get an idea of what else is out there you may be missing!
PS. Simply Wall St updates its DCF calculation for every American stock every day, so if you want to find the intrinsic value of any other stock just search here.
New: AI Stock Screener & Alerts
Our new AI Stock Screener scans the market every day to uncover opportunities.
• Dividend Powerhouses (3%+ Yield)
• Undervalued Small Caps with Insider Buying
• High growth Tech and AI Companies
Or build your own from over 50 metrics.
Have feedback on this article? Concerned about the content? Get in touch with us directly. Alternatively, email editorial-team (at) simplywallst.com.
This article by Simply Wall St is general in nature. We provide commentary based on historical data and analyst forecasts only using an unbiased methodology and our articles are not intended to be financial advice. It does not constitute a recommendation to buy or sell any stock, and does not take account of your objectives, or your financial situation. We aim to bring you long-term focused analysis driven by fundamental data. Note that our analysis may not factor in the latest price-sensitive company announcements or qualitative material. Simply Wall St has no position in any stocks mentioned.
About NYSE:OXY
Occidental Petroleum
Engages in the acquisition, exploration, and development of oil and gas properties in the United States and internationally.
Adequate balance sheet and fair value.
Similar Companies
Market Insights

Community Narratives

