Advertisement
- United States
- /
- Oil and Gas
- /
- NYSE:OXY
Assessing Occidental Petroleum’s True Value as Oil Slumps and Berkshire Ramps Up Stake

Simply Wall St
Reviewed by Bailey Pemberton
If you are weighing your options with Occidental Petroleum right now, you are not alone. Investors have recently seen the stock slide by 4.1% in the past week and edge down 1.3% over the last 30 days. Year-to-date, Occidental is off by 9.0%, and over the past year, it has dropped 14.8%. But zoom out to five years and there is a massive turnaround story, with the stock up 354.9% during that time. This dramatic ride has many wondering what is really driving the long-term potential, and whether the current price reflects opportunity or risk.
Much of this choppy performance can be traced back to shifting market outlooks for oil amid global supply debates and changing energy policy sentiment. When prices of oil swing or market expectations shift, Occidental tends to move right along with them, sometimes exaggerated in either direction. That volatility attracts both bargain hunters and cautious observers trying to gauge what the company is really worth.
So, is Occidental undervalued at today’s levels? To keep things simple, I like using a scoring system that looks at six classic valuation checks. Occidental passes 3 out of 6, so its value score sits at a straightforward 3. That signals the stock’s prospects are not exceptionally cheap but could be compelling if you know where to look.
Let’s get into the different ways analysts value Occidental, what makes each method unique, and just how well the stock stacks up. At the end, I will share one perspective that cuts through the noise and may offer even more clarity on whether Occidental deserves a spot in your portfolio.
Why Occidental Petroleum is lagging behind its peers
Approach 1: Occidental Petroleum Discounted Cash Flow (DCF) Analysis
A Discounted Cash Flow (DCF) model estimates a company's true worth by projecting its future cash flows and then discounting those numbers back to today's value. It aims to answer the core question: what is this business really worth if you account for all the cash it is likely to produce in the coming years, adjusted for present-day dollars?
For Occidental Petroleum, the DCF calculation relies on the latest twelve months' Free Cash Flow, which totals about $5.6 billion. Analyst estimates suggest Free Cash Flow will continue to grow, with forecasts approaching $5.9 billion by 2029, and even higher amounts extrapolated further out. While only five years of projections are based on analyst data, Simply Wall St extends this view with conservative growth rates for the years beyond.
After modeling these future cash flows and discounting them, the intrinsic value for Occidental Petroleum comes out to $118.79 per share. Compared to the current share price, the DCF implies the stock is trading at a 61.8% discount. This suggests the market price is significantly below the model’s estimate of fair value.
Result: UNDERVALUED
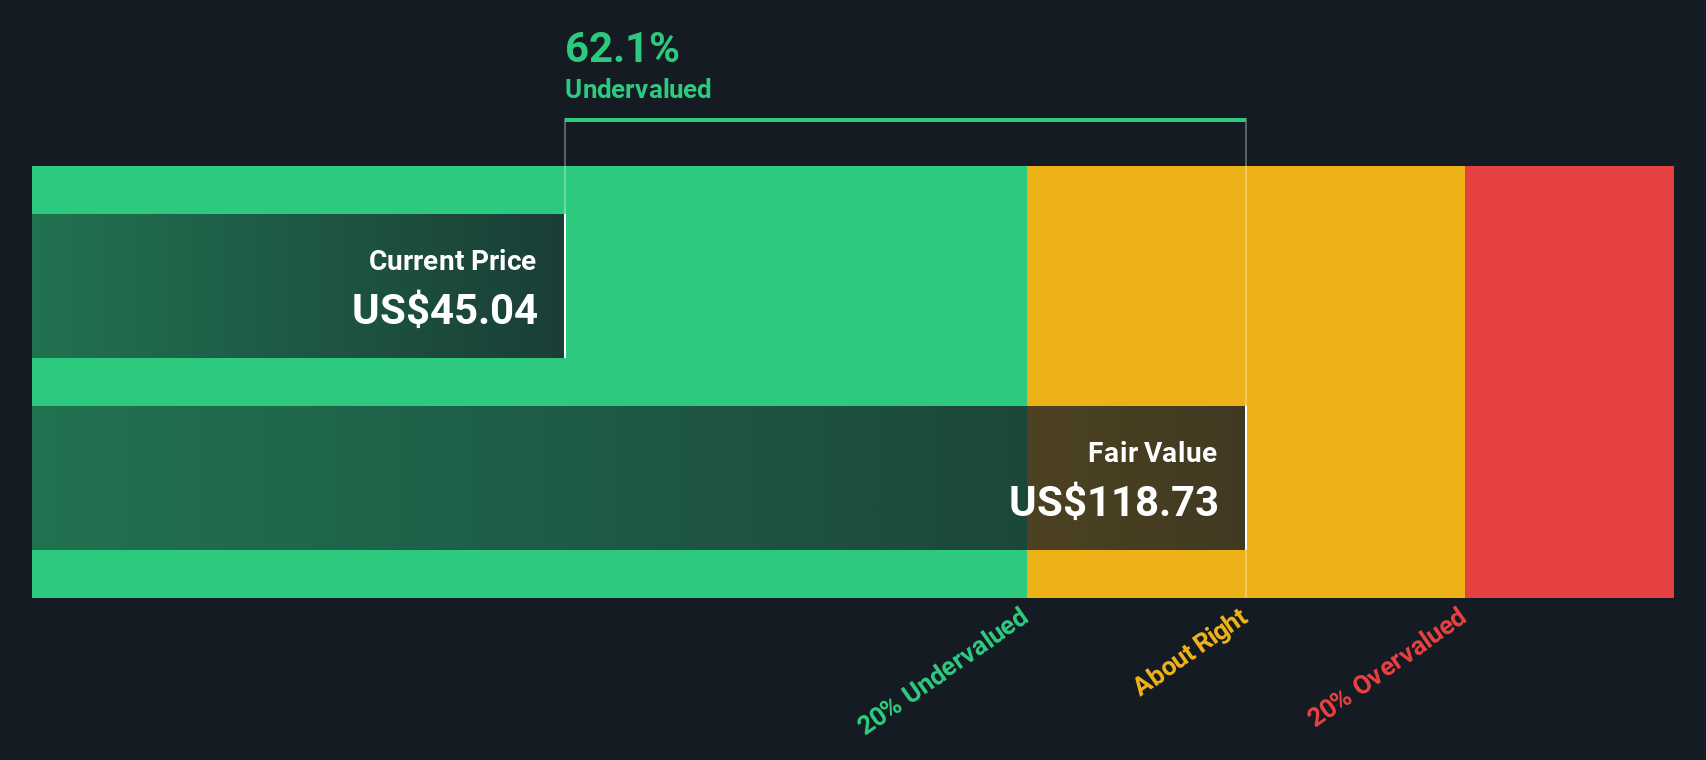
Our Discounted Cash Flow (DCF) analysis suggests Occidental Petroleum is undervalued by 61.8%. Track this in your watchlist or portfolio, or discover more undervalued stocks.
Approach 2: Occidental Petroleum Price vs Earnings
The Price-to-Earnings (PE) ratio is the most widely used metric for valuing profitable companies because it provides a quick snapshot of how much investors are paying for each dollar of current earnings. For companies like Occidental Petroleum, which continues to generate solid profits, the PE ratio serves as a practical tool to gauge if the stock is reasonably priced compared to its earnings power.
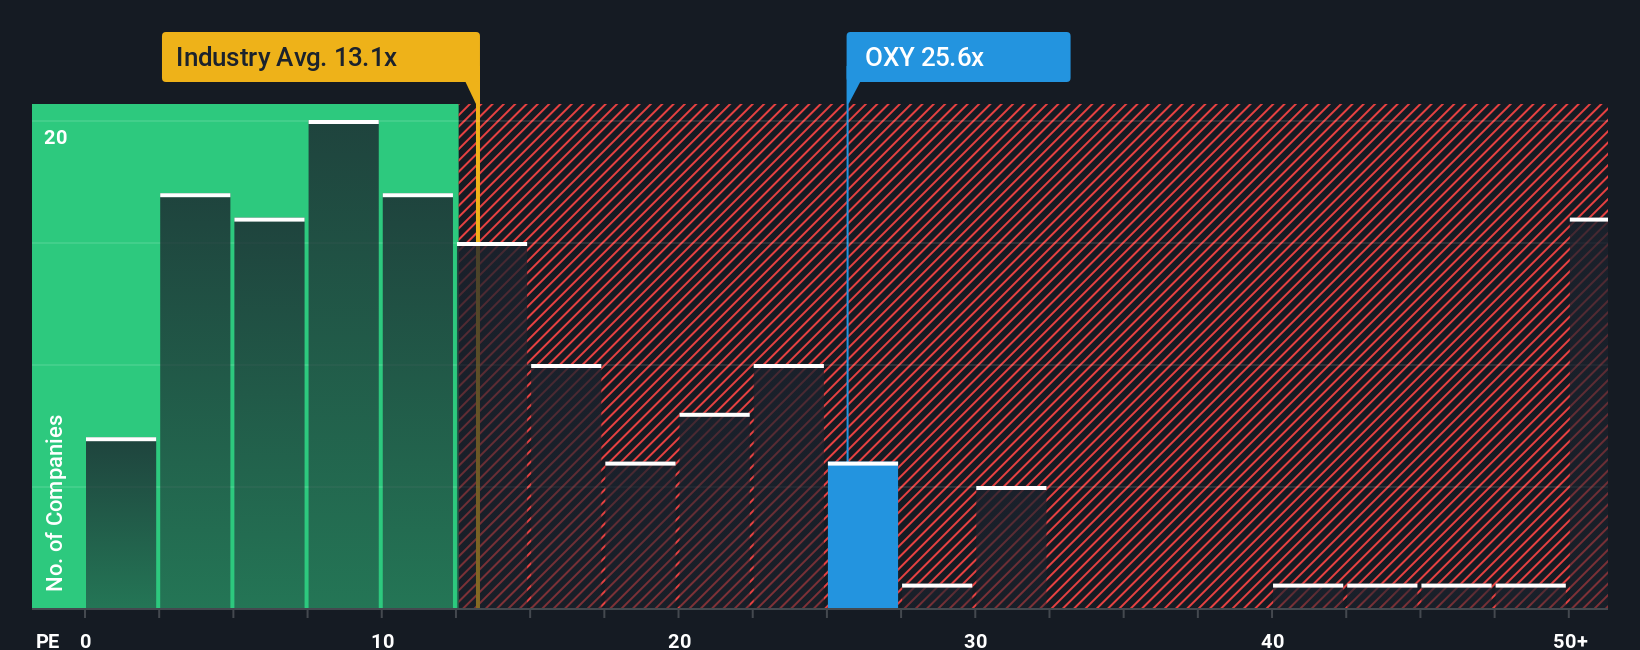
It's important to remember that what constitutes a “normal” or “fair” PE ratio depends on growth prospects and perceived risks. Higher expected growth or lower risk usually justifies a higher PE ratio, while slower growth or greater risks bring it down. Occidental's current PE ratio stands at 25.8x, which is noticeably above the Oil and Gas industry average of 13.2x, but slightly below the average of its direct peers at 32.2x.
This is where Simply Wall St's proprietary "Fair Ratio" comes in. The Fair Ratio, calculated to be 21.2x for Occidental, incorporates not just comparisons to similar companies and broad industry averages but also considers company-specific factors such as growth rates, profit margins, market cap, and risk profile. This results in a more nuanced and relevant benchmark, aiming to reflect the multiple that truly fits Occidental's unique circumstances.
In this case, Occidental’s current PE of 25.8x is moderately above its Fair Ratio of 21.2x, suggesting the market is pricing in a bit more optimism than the fundamentals alone might support. While its PE is below peer averages, it is above both the industry benchmark and what the Fair Ratio suggests as appropriate.
Result: OVERVALUED
PE ratios tell one story, but what if the real opportunity lies elsewhere? Discover companies where insiders are betting big on explosive growth.
Upgrade Your Decision Making: Choose your Occidental Petroleum Narrative
Earlier we mentioned there is an even better way to understand valuation, so let’s introduce you to Narratives. A Narrative is essentially your story about a company, the reasoning and assumptions you believe in about its future, tied directly to your own fair value estimate, and your outlook for things like revenue growth, profit margins, and risk. Narratives are powerful because they bridge the company’s unique story, the numbers that forecast its future, and a precise fair value, all brought together in one place. On Simply Wall St’s Community page, millions of investors can easily create and discuss Narratives, making them an accessible and dynamic tool. Narratives help you decide when to buy or sell by comparing your Fair Value to the current Price, and they automatically update in real-time with new company news or earnings. For Occidental Petroleum, for example, one investor’s Narrative may be bullish and set a high fair value by betting on carbon capture success and margin expansion, while another may stay cautious with a lower fair value, focused on oil price risk and debt levels. Narratives allow you to see and build your own view, grounded in both facts and your perspective.
Do you think there's more to the story for Occidental Petroleum? Create your own Narrative to let the Community know!
This article by Simply Wall St is general in nature. We provide commentary based on historical data and analyst forecasts only using an unbiased methodology and our articles are not intended to be financial advice. It does not constitute a recommendation to buy or sell any stock, and does not take account of your objectives, or your financial situation. We aim to bring you long-term focused analysis driven by fundamental data. Note that our analysis may not factor in the latest price-sensitive company announcements or qualitative material. Simply Wall St has no position in any stocks mentioned.
New: AI Stock Screener & Alerts
Our new AI Stock Screener scans the market every day to uncover opportunities.
• Dividend Powerhouses (3%+ Yield)
• Undervalued Small Caps with Insider Buying
• High growth Tech and AI Companies
Or build your own from over 50 metrics.
Have feedback on this article? Concerned about the content? Get in touch with us directly. Alternatively, email editorial-team@simplywallst.com
About NYSE:OXY
Occidental Petroleum
Engages in the acquisition, exploration, and development of oil and gas properties in the United States and internationally.
Adequate balance sheet with slight risk.
Similar Companies
Market Insights

Advertisement
Community Narratives
A formidable player in AI and enterprise computing.
Fair Value US$210.00|0.7% overvalued
CO
Community Contributor
IREN's Bold Moves in Sustainable Bitcoin Mining & AI Data Centers
Fair Value US$72.52|14.9% undervalued
BL
Community Contributor
Cooling the Champions: The Aussie Tech Behind F1's Victories
Fair Value AU$12.40|38.1% undervalued
TR
Community Contributor