
Advertisement
- United States
- /
- Oil and Gas
- /
- NYSE:OXY
Are Investors Undervaluing Occidental Petroleum Corporation (NYSE:OXY) By 36%?

Key Insights
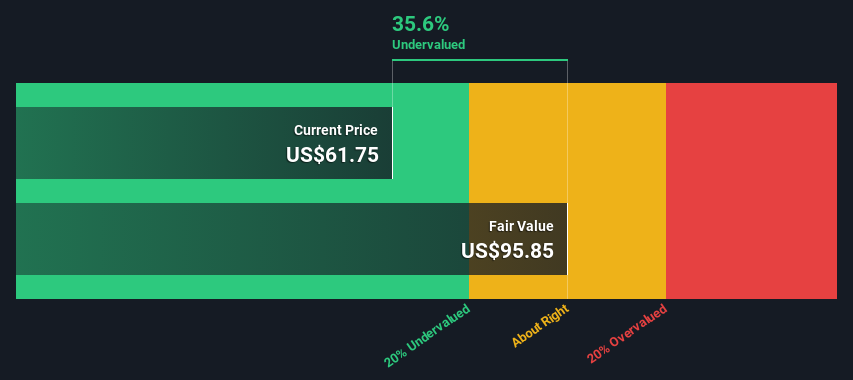
- Occidental Petroleum's estimated fair value is US$95.85 based on 2 Stage Free Cash Flow to Equity
- Occidental Petroleum is estimated to be 36% undervalued based on current share price of US$61.75
- Analyst price target for OXY is US$70.32 which is 27% below our fair value estimate
Today we'll do a simple run through of a valuation method used to estimate the attractiveness of Occidental Petroleum Corporation (NYSE:OXY) as an investment opportunity by projecting its future cash flows and then discounting them to today's value. We will use the Discounted Cash Flow (DCF) model on this occasion. It may sound complicated, but actually it is quite simple!
Companies can be valued in a lot of ways, so we would point out that a DCF is not perfect for every situation. Anyone interested in learning a bit more about intrinsic value should have a read of the Simply Wall St analysis model.
See our latest analysis for Occidental Petroleum
What's The Estimated Valuation?
We're using the 2-stage growth model, which simply means we take in account two stages of company's growth. In the initial period the company may have a higher growth rate and the second stage is usually assumed to have a stable growth rate. In the first stage we need to estimate the cash flows to the business over the next ten years. Where possible we use analyst estimates, but when these aren't available we extrapolate the previous free cash flow (FCF) from the last estimate or reported value. We assume companies with shrinking free cash flow will slow their rate of shrinkage, and that companies with growing free cash flow will see their growth rate slow, over this period. We do this to reflect that growth tends to slow more in the early years than it does in later years.
Generally we assume that a dollar today is more valuable than a dollar in the future, so we need to discount the sum of these future cash flows to arrive at a present value estimate:
10-year free cash flow (FCF) estimate
| 2024 | 2025 | 2026 | 2027 | 2028 | 2029 | 2030 | 2031 | 2032 | 2033 | |
| Levered FCF ($, Millions) | US$6.34b | US$5.74b | US$6.21b | US$6.31b | US$6.38b | US$6.47b | US$6.58b | US$6.70b | US$6.83b | US$6.97b |
| Growth Rate Estimate Source | Analyst x8 | Analyst x5 | Analyst x2 | Analyst x2 | Est @ 1.10% | Est @ 1.44% | Est @ 1.67% | Est @ 1.84% | Est @ 1.95% | Est @ 2.03% |
| Present Value ($, Millions) Discounted @ 9.0% | US$5.8k | US$4.8k | US$4.8k | US$4.5k | US$4.1k | US$3.8k | US$3.6k | US$3.4k | US$3.1k | US$2.9k |
("Est" = FCF growth rate estimated by Simply Wall St)
Present Value of 10-year Cash Flow (PVCF) = US$41b
After calculating the present value of future cash flows in the initial 10-year period, we need to calculate the Terminal Value, which accounts for all future cash flows beyond the first stage. The Gordon Growth formula is used to calculate Terminal Value at a future annual growth rate equal to the 5-year average of the 10-year government bond yield of 2.2%. We discount the terminal cash flows to today's value at a cost of equity of 9.0%.
Terminal Value (TV)= FCF2033 × (1 + g) ÷ (r – g) = US$7.0b× (1 + 2.2%) ÷ (9.0%– 2.2%) = US$104b
Present Value of Terminal Value (PVTV)= TV / (1 + r)10= US$104b÷ ( 1 + 9.0%)10= US$44b
The total value, or equity value, is then the sum of the present value of the future cash flows, which in this case is US$85b. In the final step we divide the equity value by the number of shares outstanding. Relative to the current share price of US$61.8, the company appears quite undervalued at a 36% discount to where the stock price trades currently. The assumptions in any calculation have a big impact on the valuation, so it is better to view this as a rough estimate, not precise down to the last cent.
Important Assumptions
We would point out that the most important inputs to a discounted cash flow are the discount rate and of course the actual cash flows. You don't have to agree with these inputs, I recommend redoing the calculations yourself and playing with them. The DCF also does not consider the possible cyclicality of an industry, or a company's future capital requirements, so it does not give a full picture of a company's potential performance. Given that we are looking at Occidental Petroleum as potential shareholders, the cost of equity is used as the discount rate, rather than the cost of capital (or weighted average cost of capital, WACC) which accounts for debt. In this calculation we've used 9.0%, which is based on a levered beta of 1.365. Beta is a measure of a stock's volatility, compared to the market as a whole. We get our beta from the industry average beta of globally comparable companies, with an imposed limit between 0.8 and 2.0, which is a reasonable range for a stable business.
SWOT Analysis for Occidental Petroleum
Strength
- Debt is well covered by earnings and cashflows.
- Dividends are covered by earnings and cash flows.
Weakness
- Earnings declined over the past year.
- Dividend is low compared to the top 25% of dividend payers in the Oil and Gas market.
Opportunity
- Good value based on P/E ratio and estimated fair value.
Threat
- Annual earnings are forecast to decline for the next 3 years.
Next Steps:
Valuation is only one side of the coin in terms of building your investment thesis, and it is only one of many factors that you need to assess for a company. It's not possible to obtain a foolproof valuation with a DCF model. Rather it should be seen as a guide to "what assumptions need to be true for this stock to be under/overvalued?" If a company grows at a different rate, or if its cost of equity or risk free rate changes sharply, the output can look very different. Why is the intrinsic value higher than the current share price? For Occidental Petroleum, we've compiled three further aspects you should consider:
- Risks: Every company has them, and we've spotted 3 warning signs for Occidental Petroleum (of which 1 can't be ignored!) you should know about.
- Future Earnings: How does OXY's growth rate compare to its peers and the wider market? Dig deeper into the analyst consensus number for the upcoming years by interacting with our free analyst growth expectation chart.
- Other Solid Businesses: Low debt, high returns on equity and good past performance are fundamental to a strong business. Why not explore our interactive list of stocks with solid business fundamentals to see if there are other companies you may not have considered!
PS. Simply Wall St updates its DCF calculation for every American stock every day, so if you want to find the intrinsic value of any other stock just search here.
New: AI Stock Screener & Alerts
Our new AI Stock Screener scans the market every day to uncover opportunities.
• Dividend Powerhouses (3%+ Yield)
• Undervalued Small Caps with Insider Buying
• High growth Tech and AI Companies
Or build your own from over 50 metrics.
Have feedback on this article? Concerned about the content? Get in touch with us directly. Alternatively, email editorial-team (at) simplywallst.com.
This article by Simply Wall St is general in nature. We provide commentary based on historical data and analyst forecasts only using an unbiased methodology and our articles are not intended to be financial advice. It does not constitute a recommendation to buy or sell any stock, and does not take account of your objectives, or your financial situation. We aim to bring you long-term focused analysis driven by fundamental data. Note that our analysis may not factor in the latest price-sensitive company announcements or qualitative material. Simply Wall St has no position in any stocks mentioned.
About NYSE:OXY
Occidental Petroleum
Engages in the acquisition, exploration, and development of oil and gas properties in the United States and internationally.
Adequate balance sheet and fair value.
Similar Companies
Market Insights

Advertisement
Community Narratives
Groundbreaking therapies that could change the treatment landscape for PTSD, fibromyalgia, MS & Alzheimer’s
Fair Value US$6.20|86.9% undervalued
CM
Community Contributor
DigitalOcean Will Grow 14% by Embracing AI with Paperspace Acquisition
Fair Value US$50.00|41.7% undervalued
NE
Community Contributor
Viant Technology: A Rising AdTech Challenger in the AI-Powered CTV Market
Fair Value US$38.61|63.2% undervalued
BL
Community Contributor
Volvo will Accelerate Forward into Electric and Autonomous Leadership in Five Years
Fair Value SEK 438.80|39.7% undervalued
UN
Community Contributor