- United States
- /
- Oil and Gas
- /
- NYSE:MRO
Is There An Opportunity With Marathon Oil Corporation's (NYSE:MRO) 22% Undervaluation?


Key Insights
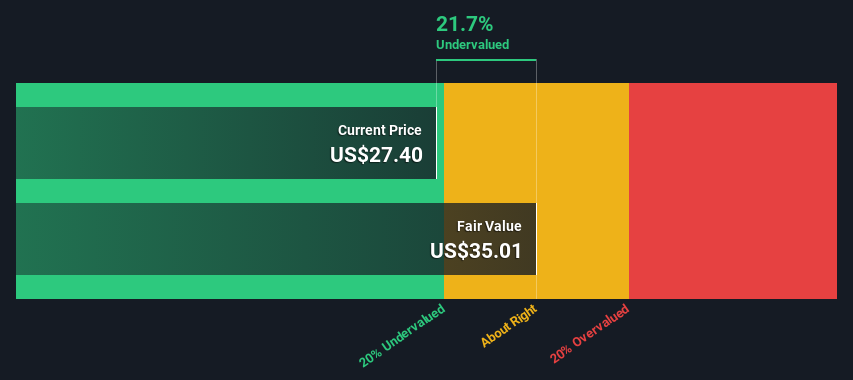
- The projected fair value for Marathon Oil is US$35.01 based on 2 Stage Free Cash Flow to Equity
- Marathon Oil's US$27.40 share price signals that it might be 22% undervalued
- Our fair value estimate is 5.2% higher than Marathon Oil's analyst price target of US$33.27
Today we will run through one way of estimating the intrinsic value of Marathon Oil Corporation (NYSE:MRO) by projecting its future cash flows and then discounting them to today's value. We will use the Discounted Cash Flow (DCF) model on this occasion. Believe it or not, it's not too difficult to follow, as you'll see from our example!
We would caution that there are many ways of valuing a company and, like the DCF, each technique has advantages and disadvantages in certain scenarios. For those who are keen learners of equity analysis, the Simply Wall St analysis model here may be something of interest to you.
View our latest analysis for Marathon Oil
Crunching The Numbers
We are going to use a two-stage DCF model, which, as the name states, takes into account two stages of growth. The first stage is generally a higher growth period which levels off heading towards the terminal value, captured in the second 'steady growth' period. To begin with, we have to get estimates of the next ten years of cash flows. Where possible we use analyst estimates, but when these aren't available we extrapolate the previous free cash flow (FCF) from the last estimate or reported value. We assume companies with shrinking free cash flow will slow their rate of shrinkage, and that companies with growing free cash flow will see their growth rate slow, over this period. We do this to reflect that growth tends to slow more in the early years than it does in later years.
A DCF is all about the idea that a dollar in the future is less valuable than a dollar today, so we need to discount the sum of these future cash flows to arrive at a present value estimate:
10-year free cash flow (FCF) estimate
| 2024 | 2025 | 2026 | 2027 | 2028 | 2029 | 2030 | 2031 | 2032 | 2033 | |
| Levered FCF ($, Millions) | US$1.95b | US$1.96b | US$1.93b | US$1.48b | US$1.48b | US$1.38b | US$1.32b | US$1.29b | US$1.28b | US$1.28b |
| Growth Rate Estimate Source | Analyst x11 | Analyst x11 | Analyst x6 | Analyst x1 | Analyst x1 | Est @ -7.01% | Est @ -4.22% | Est @ -2.27% | Est @ -0.90% | Est @ 0.06% |
| Present Value ($, Millions) Discounted @ 8.4% | US$1.8k | US$1.7k | US$1.5k | US$1.1k | US$990 | US$849 | US$750 | US$676 | US$618 | US$570 |
("Est" = FCF growth rate estimated by Simply Wall St)
Present Value of 10-year Cash Flow (PVCF) = US$11b
We now need to calculate the Terminal Value, which accounts for all the future cash flows after this ten year period. For a number of reasons a very conservative growth rate is used that cannot exceed that of a country's GDP growth. In this case we have used the 5-year average of the 10-year government bond yield (2.3%) to estimate future growth. In the same way as with the 10-year 'growth' period, we discount future cash flows to today's value, using a cost of equity of 8.4%.
Terminal Value (TV)= FCF2033 × (1 + g) ÷ (r – g) = US$1.3b× (1 + 2.3%) ÷ (8.4%– 2.3%) = US$21b
Present Value of Terminal Value (PVTV)= TV / (1 + r)10= US$21b÷ ( 1 + 8.4%)10= US$9.5b
The total value is the sum of cash flows for the next ten years plus the discounted terminal value, which results in the Total Equity Value, which in this case is US$20b. The last step is to then divide the equity value by the number of shares outstanding. Compared to the current share price of US$27.4, the company appears a touch undervalued at a 22% discount to where the stock price trades currently. Valuations are imprecise instruments though, rather like a telescope - move a few degrees and end up in a different galaxy. Do keep this in mind.
Important Assumptions
The calculation above is very dependent on two assumptions. The first is the discount rate and the other is the cash flows. Part of investing is coming up with your own evaluation of a company's future performance, so try the calculation yourself and check your own assumptions. The DCF also does not consider the possible cyclicality of an industry, or a company's future capital requirements, so it does not give a full picture of a company's potential performance. Given that we are looking at Marathon Oil as potential shareholders, the cost of equity is used as the discount rate, rather than the cost of capital (or weighted average cost of capital, WACC) which accounts for debt. In this calculation we've used 8.4%, which is based on a levered beta of 1.334. Beta is a measure of a stock's volatility, compared to the market as a whole. We get our beta from the industry average beta of globally comparable companies, with an imposed limit between 0.8 and 2.0, which is a reasonable range for a stable business.
SWOT Analysis for Marathon Oil
- Debt is well covered by earnings and cashflows.
- Dividends are covered by earnings and cash flows.
- Earnings declined over the past year.
- Dividend is low compared to the top 25% of dividend payers in the Oil and Gas market.
- Good value based on P/E ratio and estimated fair value.
- Annual earnings are forecast to decline for the next 3 years.
Next Steps:
Although the valuation of a company is important, it is only one of many factors that you need to assess for a company. DCF models are not the be-all and end-all of investment valuation. Rather it should be seen as a guide to "what assumptions need to be true for this stock to be under/overvalued?" For example, changes in the company's cost of equity or the risk free rate can significantly impact the valuation. What is the reason for the share price sitting below the intrinsic value? For Marathon Oil, we've put together three important factors you should explore:
- Risks: Consider for instance, the ever-present spectre of investment risk. We've identified 5 warning signs with Marathon Oil (at least 1 which is concerning) , and understanding these should be part of your investment process.
- Management:Have insiders been ramping up their shares to take advantage of the market's sentiment for MRO's future outlook? Check out our management and board analysis with insights on CEO compensation and governance factors.
- Other High Quality Alternatives: Do you like a good all-rounder? Explore our interactive list of high quality stocks to get an idea of what else is out there you may be missing!
PS. The Simply Wall St app conducts a discounted cash flow valuation for every stock on the NYSE every day. If you want to find the calculation for other stocks just search here.
New: Manage All Your Stock Portfolios in One Place
We've created the ultimate portfolio companion for stock investors, and it's free.
• Connect an unlimited number of Portfolios and see your total in one currency
• Be alerted to new Warning Signs or Risks via email or mobile
• Track the Fair Value of your stocks
Have feedback on this article? Concerned about the content? Get in touch with us directly. Alternatively, email editorial-team (at) simplywallst.com.
This article by Simply Wall St is general in nature. We provide commentary based on historical data and analyst forecasts only using an unbiased methodology and our articles are not intended to be financial advice. It does not constitute a recommendation to buy or sell any stock, and does not take account of your objectives, or your financial situation. We aim to bring you long-term focused analysis driven by fundamental data. Note that our analysis may not factor in the latest price-sensitive company announcements or qualitative material. Simply Wall St has no position in any stocks mentioned.
About NYSE:MRO
Marathon Oil
An independent exploration and production company, engages in exploration, production, and marketing of crude oil and condensate, natural gas liquids, and natural gas in the United States and internationally.
Slight with mediocre balance sheet.

