Advertisement
- United States
- /
- Energy Services
- /
- NYSE:FTI
Is TechnipFMC Still Attractive After $1.5 Billion Offshore Contract Win?

Simply Wall St
Reviewed by Bailey Pemberton
If TechnipFMC stock has caught your eye lately, you are definitely not alone. With a share price of $38.01 after a recent dip of 4.8% over the past week and a minor 2.3% slide over the last month, you might be wondering if this is a moment of pause or something bigger at play. However, taking a step back, the longer-term picture gets much more exciting. Year to date, this stock is up a striking 28.5%, and over the past year, it has surged 39.2%. Long-term holders have even more to celebrate, with gains of 320.5% in three years and a staggering 661.9% over five years. These returns have outpaced much of the sector and broader market indexes.
Something clearly continues to fuel optimism about TechnipFMC, despite occasional short-term wobbles. Recent industry shifts, such as renewed investment in offshore energy projects and global infrastructure deals, have made investors reconsider the long-term risk and growth profile here. Still, the big question remains: is the current price still attractive, or have the best opportunities passed?
This is where valuation matters. TechnipFMC recently notched a value score of 3 out of 6, which means it is considered undervalued on half of the major checks analysts use. In the next section, we will break down how each valuation method stacks up and why relying on these traditional approaches only tells part of the story. A more complete way to assess value may surprise you, and we will get to that before the end of the article.
Approach 1: TechnipFMC Discounted Cash Flow (DCF) Analysis
A Discounted Cash Flow (DCF) model projects a company’s future free cash flows and discounts them back to their present value. This offers an estimate of what the business is worth today. This approach is a widely used method for evaluating whether a stock is undervalued or overvalued based on the cash it is expected to generate.
For TechnipFMC, the latest reported Free Cash Flow stands at $1.43 Billion. Analyst consensus estimates project FCF to remain above $1 Billion annually for the next several years, with projections reaching $1.19 Billion in 2029. Only the first five years are grounded in analyst estimates, while values beyond that are carefully extrapolated based on recent trends and sector expectations.
According to these calculations, the DCF model arrives at an intrinsic value of $51.97 per share for TechnipFMC. Compared to the current share price of $38.01, this suggests that the stock is trading at a 26.9% discount to its estimated fair value, potentially indicating underappreciation by the market.
Result: UNDERVALUED
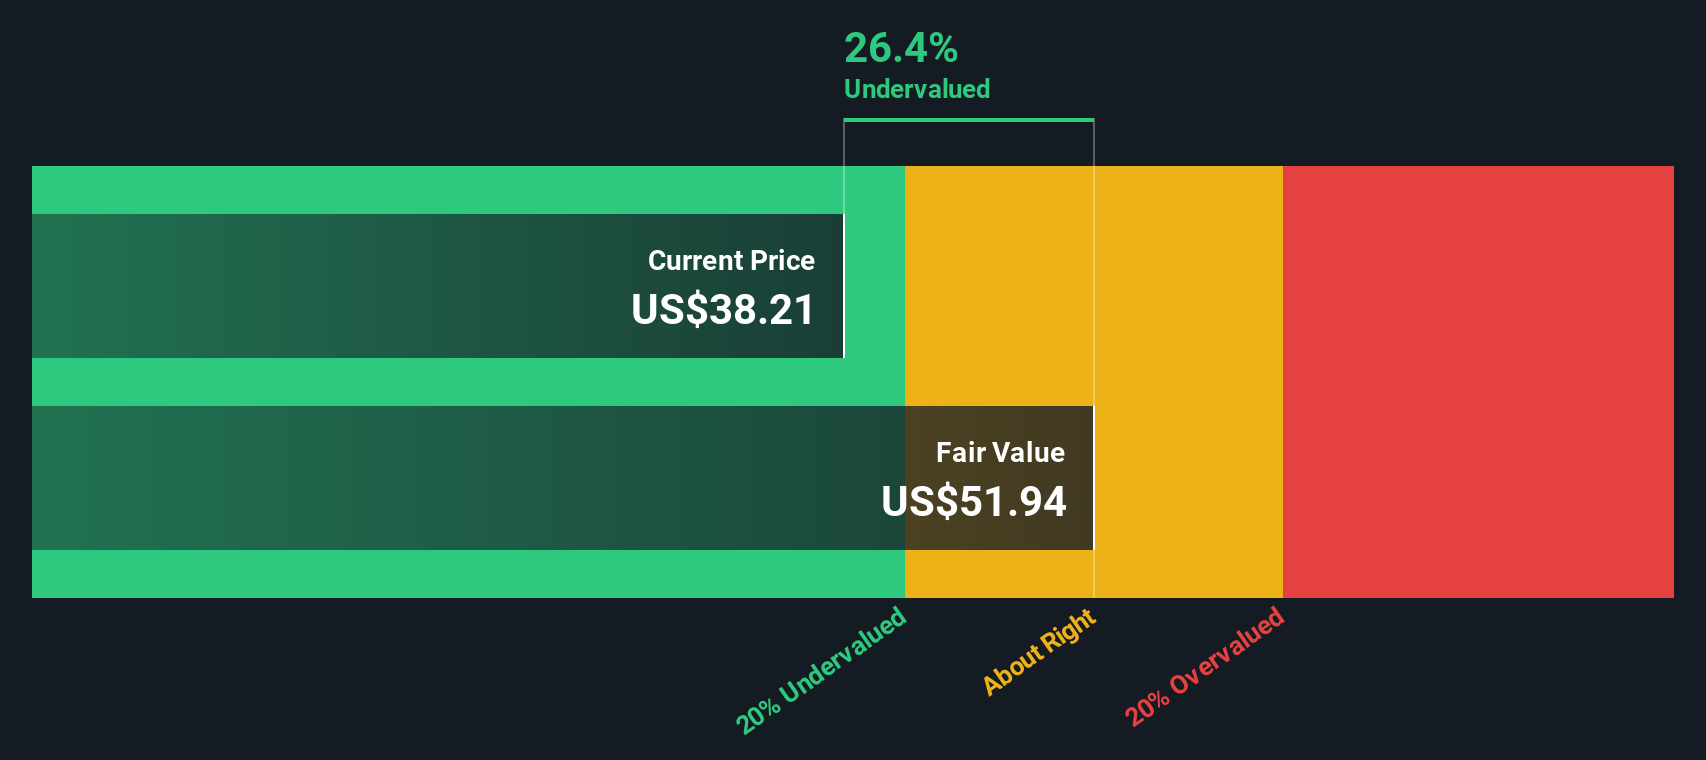
Our Discounted Cash Flow (DCF) analysis suggests TechnipFMC is undervalued by 26.9%. Track this in your watchlist or portfolio, or discover more undervalued stocks.
Approach 2: TechnipFMC Price vs Earnings
The Price-to-Earnings (PE) ratio remains one of the most popular ways to value profitable companies like TechnipFMC. This metric helps investors understand how much the market is willing to pay today for a dollar of current earnings, making it especially useful for companies with steady or growing profits.
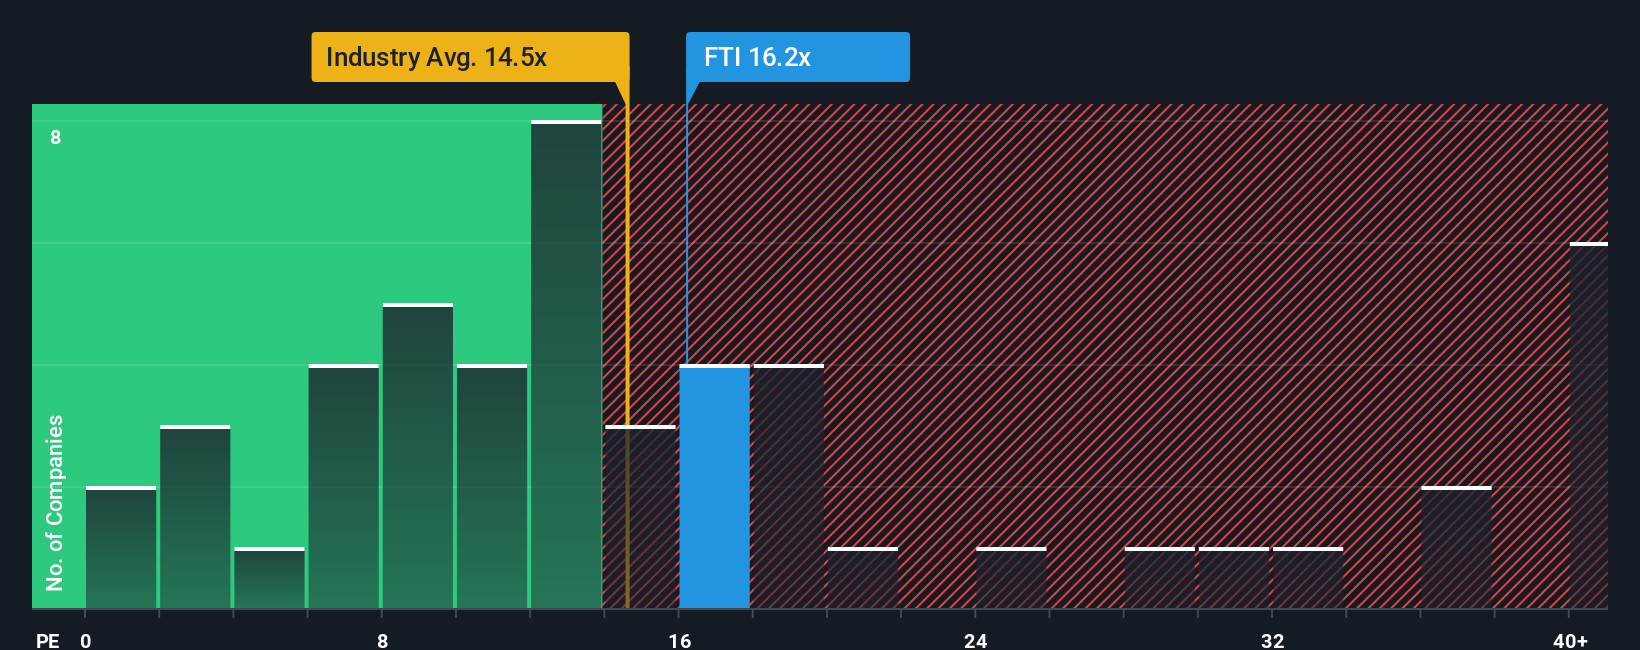
Growth expectations and perceived risks play a big role in what is considered a “normal” or “fair” PE ratio. Higher growth prospects or a robust business model can justify a higher PE, while greater risk or slower growth might push a fair PE lower. For TechnipFMC, the current PE ratio is 16.7x. This is above the industry average of 15.4x and above the peer average of 12.6x. This suggests that the market is possibly factoring in stronger growth or a premium for quality compared to its peers and the broader Energy Services sector.
This is where the Simply Wall St “Fair Ratio” comes in. The Fair Ratio uses data-driven analysis of both company factors (like earnings growth, margins, risk, and size) and industry context to provide a more tailored benchmark. For TechnipFMC, the Fair Ratio stands at 16.8x, reflecting its stable profits and sector position. Relying only on industry or peer averages can overlook important differences in growth, profitability or risk. The Fair Ratio brings these into the equation.
With the current PE of 16.7x nearly matching the Fair Ratio of 16.8x, TechnipFMC looks properly valued on this measure. This indicates that its recent performance and outlook are already reflected in the share price.
Result: ABOUT RIGHT
PE ratios tell one story, but what if the real opportunity lies elsewhere? Discover companies where insiders are betting big on explosive growth.
Upgrade Your Decision Making: Choose your TechnipFMC Narrative
Earlier, we mentioned there is an even better way to understand valuation, so let's introduce you to Narratives. A Narrative is your personal way of telling a company’s story, linking your views about where TechnipFMC is headed with your assumptions about its future growth, margins, and ultimately, what you believe its fair value should be.
Rather than relying solely on traditional numbers, Narratives empower you to connect your unique perspective on industry trends, company strengths, and risks with a custom financial forecast. This results in a fair value that makes sense to you. Narratives are simple and accessible: you can create your own or explore thousands of perspectives from investors on Simply Wall St’s Community page.
They also provide practical insight for decisions. By comparing your fair value to the current share price, Narratives help you make confident, informed choices about when to buy or sell. Best of all, Narratives update dynamically as new information comes in, so your view stays relevant as TechnipFMC’s story evolves.
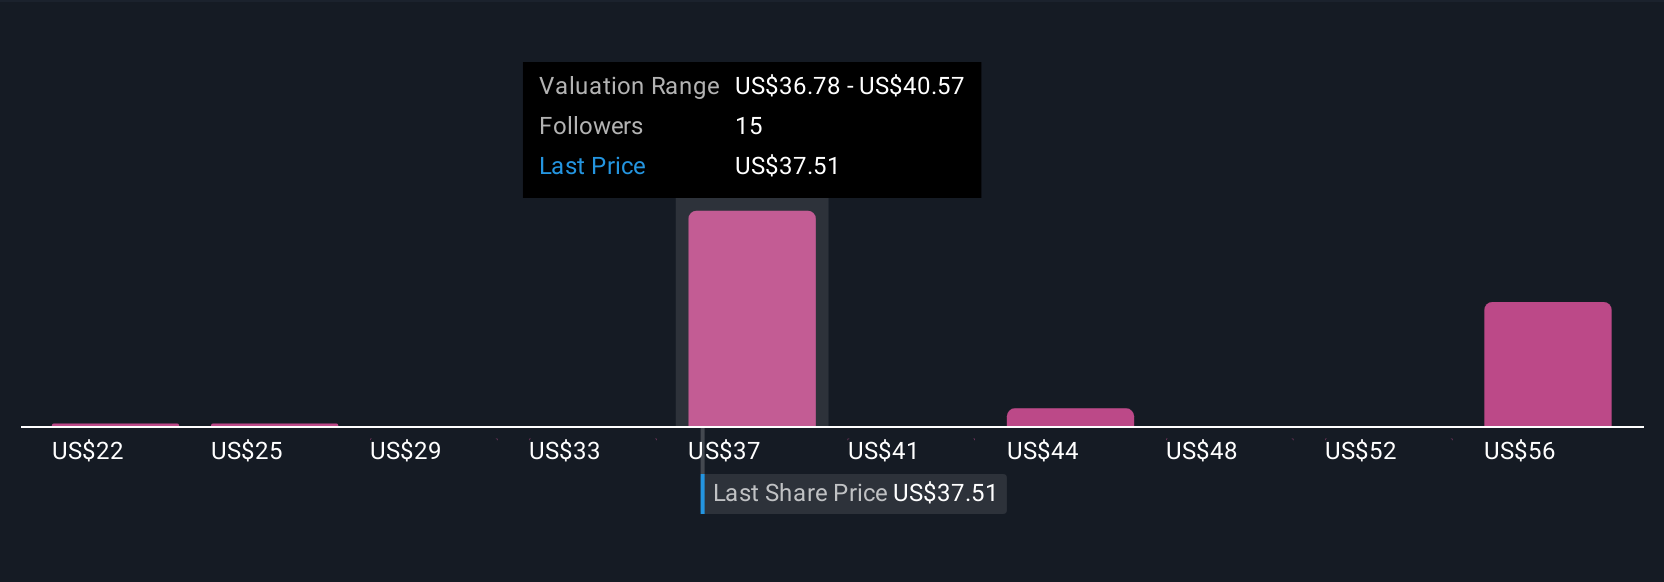
For example, some TechnipFMC Narratives assume earnings could surge to $1.4 billion by 2028 with a fair value as high as $51, while more cautious Narratives expect earnings near $914 million and fair value as low as $30. This shows how perspectives can differ while always putting the story in your hands.
Do you think there's more to the story for TechnipFMC? Create your own Narrative to let the Community know!
This article by Simply Wall St is general in nature. We provide commentary based on historical data and analyst forecasts only using an unbiased methodology and our articles are not intended to be financial advice. It does not constitute a recommendation to buy or sell any stock, and does not take account of your objectives, or your financial situation. We aim to bring you long-term focused analysis driven by fundamental data. Note that our analysis may not factor in the latest price-sensitive company announcements or qualitative material. Simply Wall St has no position in any stocks mentioned.
Valuation is complex, but we're here to simplify it.
Discover if TechnipFMC might be undervalued or overvalued with our detailed analysis, featuring fair value estimates, potential risks, dividends, insider trades, and its financial condition.
Access Free AnalysisHave feedback on this article? Concerned about the content? Get in touch with us directly. Alternatively, email editorial-team@simplywallst.com
About NYSE:FTI
TechnipFMC
Engages in the energy projects, technologies, systems, and services businesses in Europe, Central Asia, North America, Latin America, the Asia Pacific, Africa, the Middle East, and internationally.
Outstanding track record with flawless balance sheet.
Similar Companies
Market Insights

Advertisement
Community Narratives
The Next Phase of Energy Storage: How NeoVolta Is Tackling America’s Power Crunch
Fair Value US$7.50|30.4% undervalued
MA
Community Contributor
A formidable player in AI and enterprise computing.
Fair Value US$210.00|3.0% undervalued
CO
Community Contributor
IREN's Bold Moves in Sustainable Bitcoin Mining & AI Data Centers
Fair Value US$72.52|20.4% undervalued
BL
Community Contributor
Cooling the Champions: The Aussie Tech Behind F1's Victories
Fair Value AU$12.40|38.1% undervalued
TR
Community Contributor