- United States
- /
- Oil and Gas
- /
- NYSE:FRO
Frontline plc (NYSE:FRO) Shares Could Be 28% Below Their Intrinsic Value Estimate


Key Insights
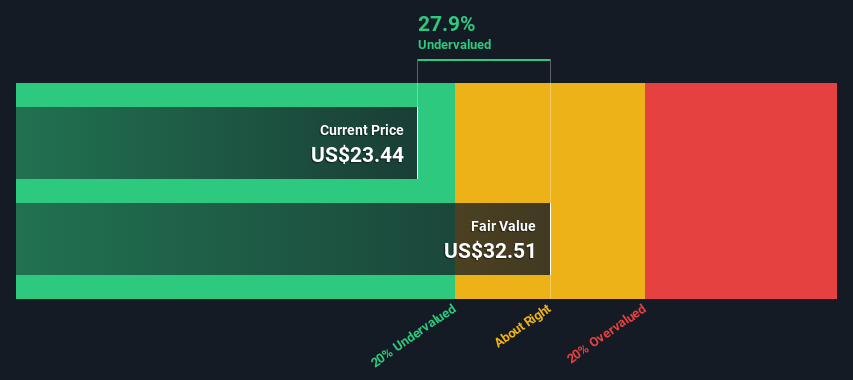
- The projected fair value for Frontline is US$32.51 based on 2 Stage Free Cash Flow to Equity
- Current share price of US$23.44 suggests Frontline is potentially 28% undervalued
- Analyst price target for FRO is US$26.90 which is 17% below our fair value estimate
How far off is Frontline plc (NYSE:FRO) from its intrinsic value? Using the most recent financial data, we'll take a look at whether the stock is fairly priced by estimating the company's future cash flows and discounting them to their present value. We will take advantage of the Discounted Cash Flow (DCF) model for this purpose. Believe it or not, it's not too difficult to follow, as you'll see from our example!
We generally believe that a company's value is the present value of all of the cash it will generate in the future. However, a DCF is just one valuation metric among many, and it is not without flaws. If you still have some burning questions about this type of valuation, take a look at the Simply Wall St analysis model.
Check out our latest analysis for Frontline
Is Frontline Fairly Valued?
We are going to use a two-stage DCF model, which, as the name states, takes into account two stages of growth. The first stage is generally a higher growth period which levels off heading towards the terminal value, captured in the second 'steady growth' period. To start off with, we need to estimate the next ten years of cash flows. Where possible we use analyst estimates, but when these aren't available we extrapolate the previous free cash flow (FCF) from the last estimate or reported value. We assume companies with shrinking free cash flow will slow their rate of shrinkage, and that companies with growing free cash flow will see their growth rate slow, over this period. We do this to reflect that growth tends to slow more in the early years than it does in later years.
A DCF is all about the idea that a dollar in the future is less valuable than a dollar today, so we discount the value of these future cash flows to their estimated value in today's dollars:
10-year free cash flow (FCF) estimate
| 2024 | 2025 | 2026 | 2027 | 2028 | 2029 | 2030 | 2031 | 2032 | 2033 | |
| Levered FCF ($, Millions) | US$331.7m | US$1.04b | US$1.00b | US$984.6m | US$980.7m | US$984.8m | US$994.4m | US$1.01b | US$1.02b | US$1.04b |
| Growth Rate Estimate Source | Analyst x3 | Analyst x5 | Analyst x3 | Est @ -1.54% | Est @ -0.39% | Est @ 0.41% | Est @ 0.98% | Est @ 1.37% | Est @ 1.65% | Est @ 1.84% |
| Present Value ($, Millions) Discounted @ 14% | US$291 | US$799 | US$679 | US$587 | US$514 | US$453 | US$402 | US$358 | US$320 | US$286 |
("Est" = FCF growth rate estimated by Simply Wall St)
Present Value of 10-year Cash Flow (PVCF) = US$4.7b
We now need to calculate the Terminal Value, which accounts for all the future cash flows after this ten year period. For a number of reasons a very conservative growth rate is used that cannot exceed that of a country's GDP growth. In this case we have used the 5-year average of the 10-year government bond yield (2.3%) to estimate future growth. In the same way as with the 10-year 'growth' period, we discount future cash flows to today's value, using a cost of equity of 14%.
Terminal Value (TV)= FCF2033 × (1 + g) ÷ (r – g) = US$1.0b× (1 + 2.3%) ÷ (14%– 2.3%) = US$9.3b
Present Value of Terminal Value (PVTV)= TV / (1 + r)10= US$9.3b÷ ( 1 + 14%)10= US$2.5b
The total value, or equity value, is then the sum of the present value of the future cash flows, which in this case is US$7.2b. The last step is to then divide the equity value by the number of shares outstanding. Relative to the current share price of US$23.4, the company appears a touch undervalued at a 28% discount to where the stock price trades currently. The assumptions in any calculation have a big impact on the valuation, so it is better to view this as a rough estimate, not precise down to the last cent.
Important Assumptions
The calculation above is very dependent on two assumptions. The first is the discount rate and the other is the cash flows. Part of investing is coming up with your own evaluation of a company's future performance, so try the calculation yourself and check your own assumptions. The DCF also does not consider the possible cyclicality of an industry, or a company's future capital requirements, so it does not give a full picture of a company's potential performance. Given that we are looking at Frontline as potential shareholders, the cost of equity is used as the discount rate, rather than the cost of capital (or weighted average cost of capital, WACC) which accounts for debt. In this calculation we've used 14%, which is based on a levered beta of 1.560. Beta is a measure of a stock's volatility, compared to the market as a whole. We get our beta from the industry average beta of globally comparable companies, with an imposed limit between 0.8 and 2.0, which is a reasonable range for a stable business.
SWOT Analysis for Frontline
- Earnings growth over the past year exceeded the industry.
- Debt is well covered by earnings and cashflows.
- Dividend is in the top 25% of dividend payers in the market.
- No major weaknesses identified for FRO.
- Annual earnings are forecast to grow for the next 3 years.
- Good value based on P/E ratio and estimated fair value.
- Paying a dividend but company has no free cash flows.
- Annual earnings are forecast to grow slower than the American market.
Moving On:
Whilst important, the DCF calculation shouldn't be the only metric you look at when researching a company. The DCF model is not a perfect stock valuation tool. Preferably you'd apply different cases and assumptions and see how they would impact the company's valuation. For instance, if the terminal value growth rate is adjusted slightly, it can dramatically alter the overall result. Can we work out why the company is trading at a discount to intrinsic value? For Frontline, we've compiled three fundamental items you should explore:
- Risks: You should be aware of the 3 warning signs for Frontline (1 shouldn't be ignored!) we've uncovered before considering an investment in the company.
- Future Earnings: How does FRO's growth rate compare to its peers and the wider market? Dig deeper into the analyst consensus number for the upcoming years by interacting with our free analyst growth expectation chart.
- Other Solid Businesses: Low debt, high returns on equity and good past performance are fundamental to a strong business. Why not explore our interactive list of stocks with solid business fundamentals to see if there are other companies you may not have considered!
PS. The Simply Wall St app conducts a discounted cash flow valuation for every stock on the NYSE every day. If you want to find the calculation for other stocks just search here.
New: AI Stock Screener & Alerts
Our new AI Stock Screener scans the market every day to uncover opportunities.
• Dividend Powerhouses (3%+ Yield)
• Undervalued Small Caps with Insider Buying
• High growth Tech and AI Companies
Or build your own from over 50 metrics.
Have feedback on this article? Concerned about the content? Get in touch with us directly. Alternatively, email editorial-team (at) simplywallst.com.
This article by Simply Wall St is general in nature. We provide commentary based on historical data and analyst forecasts only using an unbiased methodology and our articles are not intended to be financial advice. It does not constitute a recommendation to buy or sell any stock, and does not take account of your objectives, or your financial situation. We aim to bring you long-term focused analysis driven by fundamental data. Note that our analysis may not factor in the latest price-sensitive company announcements or qualitative material. Simply Wall St has no position in any stocks mentioned.
About NYSE:FRO
Frontline
A shipping company, engages in the ownership and operation of oil and product tankers worldwide.
Very undervalued slight.
Similar Companies
Market Insights

Community Narratives

