Advertisement
- United States
- /
- Energy Services
- /
- NasdaqGS:WFRD
What Does Weatherford’s Recent 5% Drop Mean for Its 2025 Valuation?

Simply Wall St
Reviewed by Bailey Pemberton
Thinking about what to do with Weatherford International right now? You are not alone. The stock has been a wild ride for investors, and every move seems to spark a fresh debate. Just look at the numbers, and you will see what I mean: after falling 5.1% over the past week, Weatherford is still up an eye-popping 2,711.6% over the last five years. The past month brought a modest 4.2% gain, but shares remain down nearly 10% year to date. Despite a tough 12 months, with a 28.2% drop, the long-term chart makes it clear this company has grown far beyond many of its peers.
When share prices move like this, the market is telling a story about evolving risks and new opportunities. A lot of the recent price action comes as macro trends in the energy sector shift, and investors try to figure out how Weatherford fits into a changing landscape for oil and services companies.
So, is the current price an opportunity or a trap? According to the valuation scorecard, Weatherford International scores a 5 out of 6 on undervaluation checks, which suggests some real upside potential. Now, let us take a closer look at the different valuation approaches. Stick around, because I will also share an even better way to cut through the noise by the end of this article.
Why Weatherford International is lagging behind its peers
Approach 1: Weatherford International Discounted Cash Flow (DCF) Analysis
A Discounted Cash Flow (DCF) model estimates a company's value by projecting its future cash flows and discounting them back to their value today. This approach helps investors understand what a business is fundamentally worth based on its ability to generate cash in the future.
For Weatherford International, the most recent reported Free Cash Flow (FCF) is $537.6 million. Analyst estimates cover the next several years, with FCF projected to reach $767.7 million by 2028. Ten-year projections extrapolated by Simply Wall St show continued growth, with discounted FCF expected to be $486.1 million by 2035. These forward-looking numbers indicate that Weatherford's cash generation is set to improve steadily, though all estimates remain below $1 billion over the forecast period.
Based on this two-stage Free Cash Flow to Equity model, the calculated intrinsic value per share is $215.40. With the current market price showing a 69.8% discount to this estimate, the DCF model signals Weatherford International is deeply undervalued compared to what its future cash flows suggest it is worth.
Result: UNDERVALUED
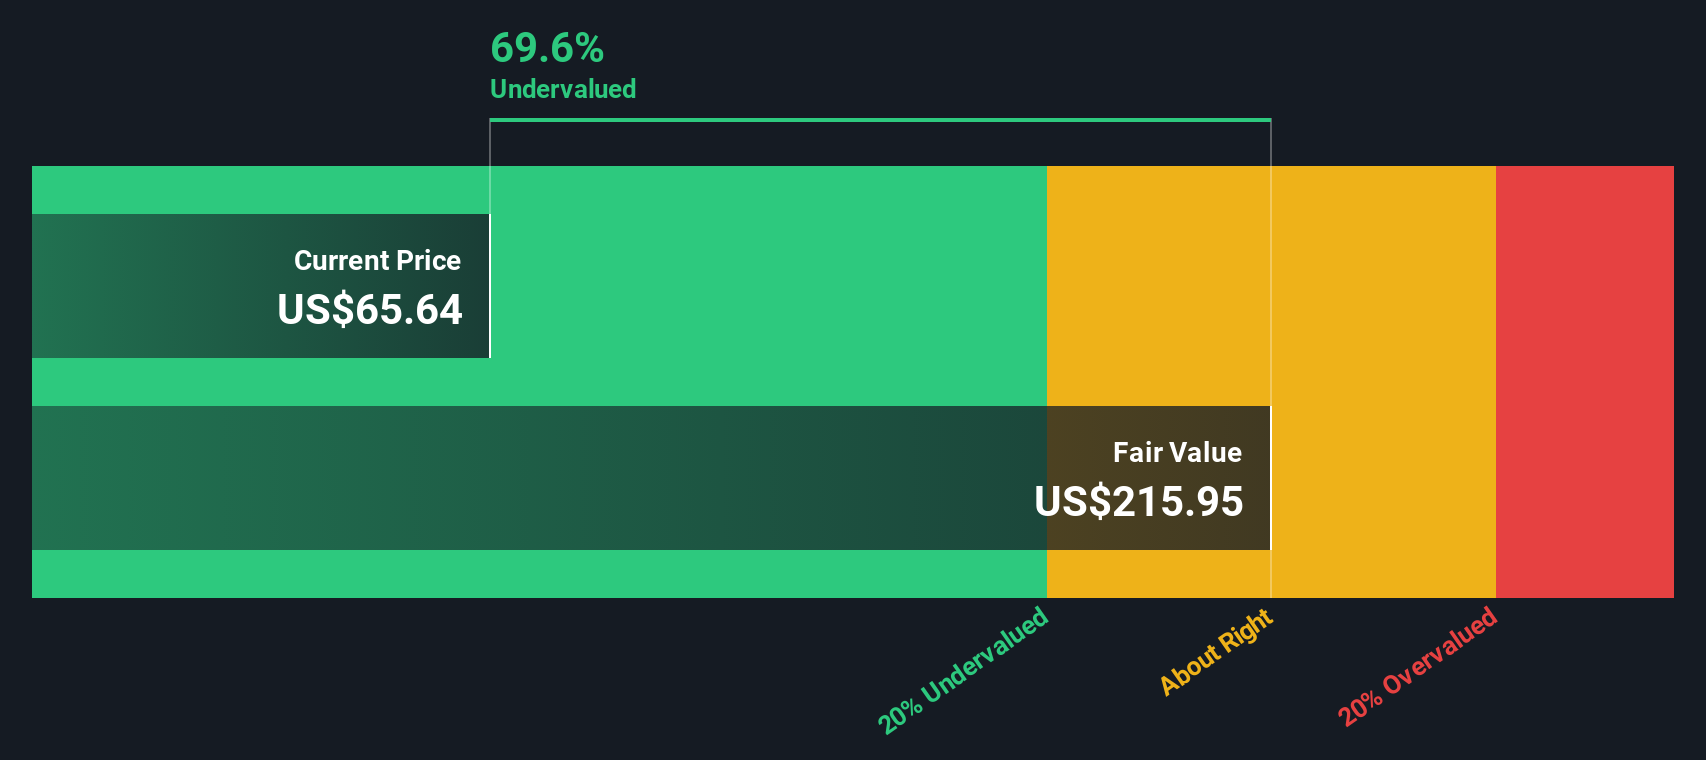
Our Discounted Cash Flow (DCF) analysis suggests Weatherford International is undervalued by 69.8%. Track this in your watchlist or portfolio, or discover more undervalued stocks.
Approach 2: Weatherford International Price vs Earnings
For companies like Weatherford International that are posting profits, the price-to-earnings (PE) ratio is a popular way to judge value. The PE ratio reflects what investors are willing to pay today for a dollar of future earnings, and is generally higher for companies expected to grow faster or perceived as less risky. Growth expectations, profit quality, and risk profile all influence what a "normal" PE should look like for any given business.
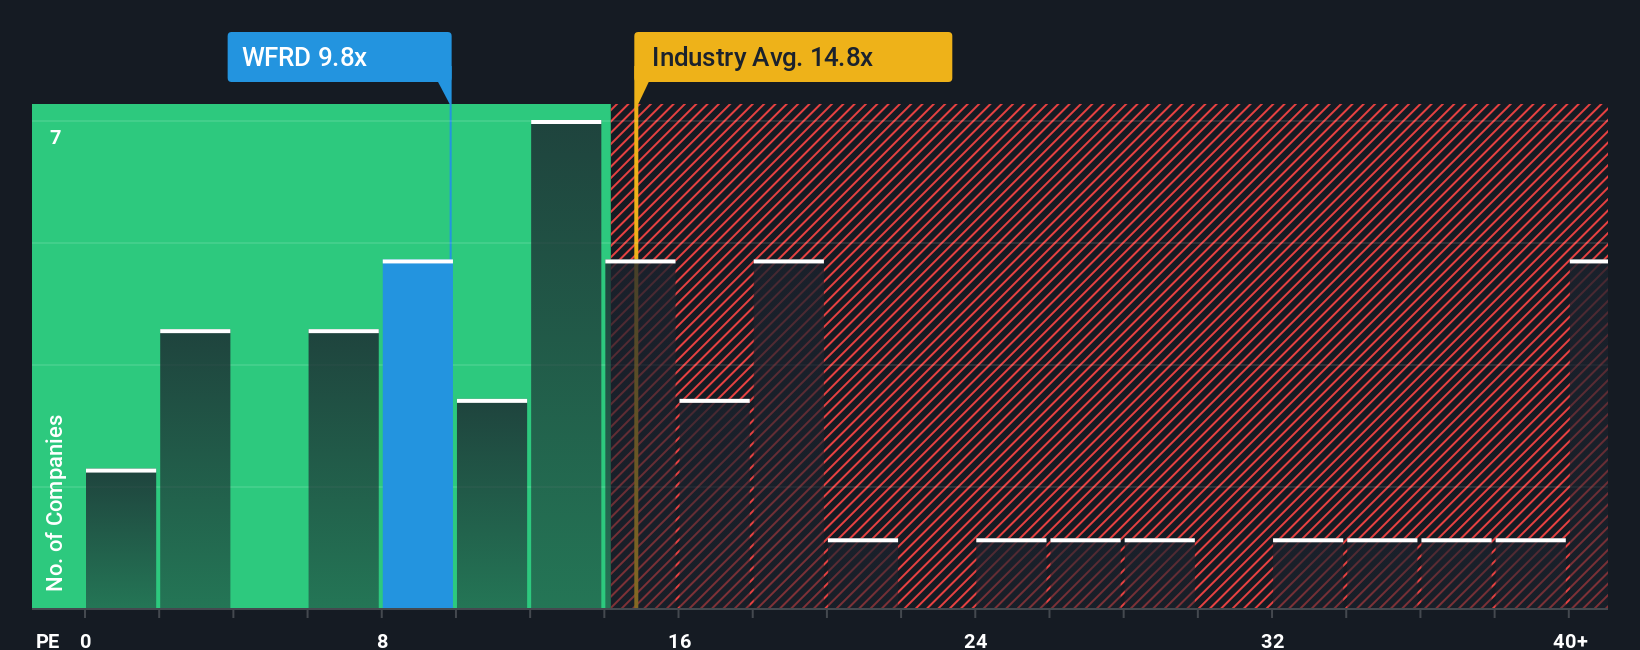
Currently, Weatherford International trades at a PE ratio of 9.7x. For context, this is well below the Energy Services industry average of 15.4x and even further beneath the peer group average of 40.8x. While comparing against these broad benchmarks can be useful, it does not tell the full story. That is where Simply Wall St's proprietary "Fair Ratio" comes in. For Weatherford, the Fair Ratio is calculated at 14.8x, which is based on a detailed mix of growth projections, profit margins, company risks, industry dynamics, and market cap. This makes it a more tailored point of comparison than blunt industry averages.
With Weatherford International’s actual PE ratio sitting well under the Fair Ratio, the numbers strongly suggest the stock remains undervalued using this method as well.
Result: UNDERVALUED
PE ratios tell one story, but what if the real opportunity lies elsewhere? Discover companies where insiders are betting big on explosive growth.
Upgrade Your Decision Making: Choose your Weatherford International Narrative
Earlier, we mentioned that there's an even better way to understand valuation, so let's introduce you to Narratives. A Narrative is a simple, accessible tool that lets you link your own perspective on Weatherford International—how you think its story will play out—to actual financial forecasts like future revenue, margins, and an estimated fair value. Rather than just relying on static ratios or models, Narratives let investors connect the company’s evolving story with hard numbers, making it easier to cut through noise and focus on what really matters.
On Simply Wall St’s Community page, you can create or follow Narratives, joining millions of investors who want to visualize how their beliefs—and others’—convert into fair value compared to today’s price. This dynamic approach helps you decide when to buy or sell, as Narratives update automatically whenever new information, such as earnings or company news, is released. For example, some investors believe Weatherford International deserves a bullish price target of $74 if they’re confident that advanced technologies and margin expansion will drive future growth, while others set a more cautious target of $58, citing risks like prolonged market weakness and cash flow uncertainty. With Narratives, you can see these differing perspectives, understand the “why” behind each forecast, and quickly identify which storyline best matches your own outlook on the stock.
Do you think there's more to the story for Weatherford International? Create your own Narrative to let the Community know!

This article by Simply Wall St is general in nature. We provide commentary based on historical data and analyst forecasts only using an unbiased methodology and our articles are not intended to be financial advice. It does not constitute a recommendation to buy or sell any stock, and does not take account of your objectives, or your financial situation. We aim to bring you long-term focused analysis driven by fundamental data. Note that our analysis may not factor in the latest price-sensitive company announcements or qualitative material. Simply Wall St has no position in any stocks mentioned.
Valuation is complex, but we're here to simplify it.
Discover if Weatherford International might be undervalued or overvalued with our detailed analysis, featuring fair value estimates, potential risks, dividends, insider trades, and its financial condition.
Access Free AnalysisHave feedback on this article? Concerned about the content? Get in touch with us directly. Alternatively, email editorial-team@simplywallst.com
About NasdaqGS:WFRD
Weatherford International
An energy services company, provides equipment and services for the drilling, evaluation, completion, production, and intervention of oil, geothermal, and natural gas wells worldwide.
Flawless balance sheet and undervalued.
Similar Companies
Market Insights

Advertisement
Community Narratives
A formidable player in AI and enterprise computing.
Fair Value US$210.00|12.2% overvalued
CO
Community Contributor
IREN's Bold Moves in Sustainable Bitcoin Mining & AI Data Centers
Fair Value US$72.52|17.1% undervalued
BL
Community Contributor
Cooling the Champions: The Aussie Tech Behind F1's Victories
Fair Value AU$12.40|38.1% undervalued
TR
Community Contributor