- United States
- /
- Oil and Gas
- /
- NasdaqGS:FANG
Is Diamondback Energy, Inc. (NASDAQ:FANG) Trading At A 24% Discount?


Key Insights
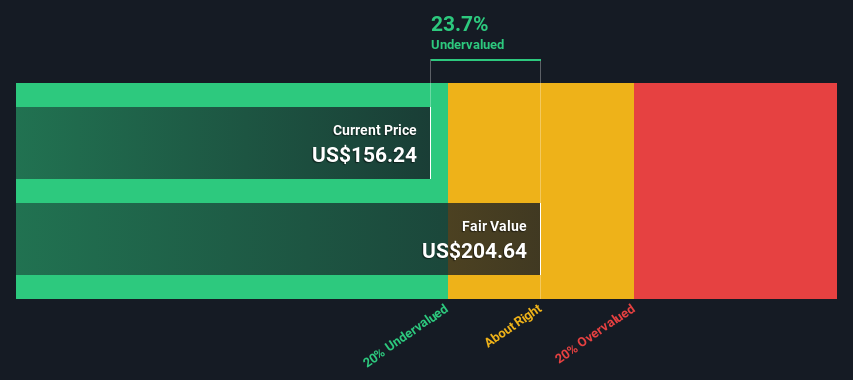
- Using the 2 Stage Free Cash Flow to Equity, Diamondback Energy fair value estimate is US$205
- Current share price of US$156 suggests Diamondback Energy is potentially 24% undervalued
- The US$178 analyst price target for FANG is 13% less than our estimate of fair value
How far off is Diamondback Energy, Inc. (NASDAQ:FANG) from its intrinsic value? Using the most recent financial data, we'll take a look at whether the stock is fairly priced by taking the expected future cash flows and discounting them to their present value. We will use the Discounted Cash Flow (DCF) model on this occasion. There's really not all that much to it, even though it might appear quite complex.
Companies can be valued in a lot of ways, so we would point out that a DCF is not perfect for every situation. Anyone interested in learning a bit more about intrinsic value should have a read of the Simply Wall St analysis model.
Check out our latest analysis for Diamondback Energy
Crunching The Numbers
We are going to use a two-stage DCF model, which, as the name states, takes into account two stages of growth. The first stage is generally a higher growth period which levels off heading towards the terminal value, captured in the second 'steady growth' period. To start off with, we need to estimate the next ten years of cash flows. Where possible we use analyst estimates, but when these aren't available we extrapolate the previous free cash flow (FCF) from the last estimate or reported value. We assume companies with shrinking free cash flow will slow their rate of shrinkage, and that companies with growing free cash flow will see their growth rate slow, over this period. We do this to reflect that growth tends to slow more in the early years than it does in later years.
A DCF is all about the idea that a dollar in the future is less valuable than a dollar today, so we need to discount the sum of these future cash flows to arrive at a present value estimate:
10-year free cash flow (FCF) forecast
| 2024 | 2025 | 2026 | 2027 | 2028 | 2029 | 2030 | 2031 | 2032 | 2033 | |
| Levered FCF ($, Millions) | US$2.94b | US$3.06b | US$3.12b | US$2.46b | US$2.42b | US$2.40b | US$2.41b | US$2.43b | US$2.46b | US$2.50b |
| Growth Rate Estimate Source | Analyst x15 | Analyst x15 | Analyst x5 | Analyst x3 | Analyst x3 | Est @ -0.51% | Est @ 0.31% | Est @ 0.88% | Est @ 1.28% | Est @ 1.56% |
| Present Value ($, Millions) Discounted @ 8.3% | US$2.7k | US$2.6k | US$2.5k | US$1.8k | US$1.6k | US$1.5k | US$1.4k | US$1.3k | US$1.2k | US$1.1k |
("Est" = FCF growth rate estimated by Simply Wall St)
Present Value of 10-year Cash Flow (PVCF) = US$18b
After calculating the present value of future cash flows in the initial 10-year period, we need to calculate the Terminal Value, which accounts for all future cash flows beyond the first stage. The Gordon Growth formula is used to calculate Terminal Value at a future annual growth rate equal to the 5-year average of the 10-year government bond yield of 2.2%. We discount the terminal cash flows to today's value at a cost of equity of 8.3%.
Terminal Value (TV)= FCF2033 × (1 + g) ÷ (r – g) = US$2.5b× (1 + 2.2%) ÷ (8.3%– 2.2%) = US$42b
Present Value of Terminal Value (PVTV)= TV / (1 + r)10= US$42b÷ ( 1 + 8.3%)10= US$19b
The total value, or equity value, is then the sum of the present value of the future cash flows, which in this case is US$37b. In the final step we divide the equity value by the number of shares outstanding. Relative to the current share price of US$156, the company appears a touch undervalued at a 24% discount to where the stock price trades currently. Remember though, that this is just an approximate valuation, and like any complex formula - garbage in, garbage out.
Important Assumptions
The calculation above is very dependent on two assumptions. The first is the discount rate and the other is the cash flows. You don't have to agree with these inputs, I recommend redoing the calculations yourself and playing with them. The DCF also does not consider the possible cyclicality of an industry, or a company's future capital requirements, so it does not give a full picture of a company's potential performance. Given that we are looking at Diamondback Energy as potential shareholders, the cost of equity is used as the discount rate, rather than the cost of capital (or weighted average cost of capital, WACC) which accounts for debt. In this calculation we've used 8.3%, which is based on a levered beta of 1.216. Beta is a measure of a stock's volatility, compared to the market as a whole. We get our beta from the industry average beta of globally comparable companies, with an imposed limit between 0.8 and 2.0, which is a reasonable range for a stable business.
SWOT Analysis for Diamondback Energy
- Debt is not viewed as a risk.
- Dividend is in the top 25% of dividend payers in the market.
- Earnings declined over the past year.
- Good value based on P/E ratio and estimated fair value.
- Dividends are not covered by cash flow.
- Annual earnings are forecast to decline for the next 4 years.
Looking Ahead:
Whilst important, the DCF calculation ideally won't be the sole piece of analysis you scrutinize for a company. It's not possible to obtain a foolproof valuation with a DCF model. Instead the best use for a DCF model is to test certain assumptions and theories to see if they would lead to the company being undervalued or overvalued. For instance, if the terminal value growth rate is adjusted slightly, it can dramatically alter the overall result. Can we work out why the company is trading at a discount to intrinsic value? For Diamondback Energy, we've compiled three fundamental items you should consider:
- Risks: To that end, you should learn about the 2 warning signs we've spotted with Diamondback Energy (including 1 which doesn't sit too well with us) .
- Future Earnings: How does FANG's growth rate compare to its peers and the wider market? Dig deeper into the analyst consensus number for the upcoming years by interacting with our free analyst growth expectation chart.
- Other High Quality Alternatives: Do you like a good all-rounder? Explore our interactive list of high quality stocks to get an idea of what else is out there you may be missing!
PS. The Simply Wall St app conducts a discounted cash flow valuation for every stock on the NASDAQGS every day. If you want to find the calculation for other stocks just search here.
New: Manage All Your Stock Portfolios in One Place
We've created the ultimate portfolio companion for stock investors, and it's free.
• Connect an unlimited number of Portfolios and see your total in one currency
• Be alerted to new Warning Signs or Risks via email or mobile
• Track the Fair Value of your stocks
Have feedback on this article? Concerned about the content? Get in touch with us directly. Alternatively, email editorial-team (at) simplywallst.com.
This article by Simply Wall St is general in nature. We provide commentary based on historical data and analyst forecasts only using an unbiased methodology and our articles are not intended to be financial advice. It does not constitute a recommendation to buy or sell any stock, and does not take account of your objectives, or your financial situation. We aim to bring you long-term focused analysis driven by fundamental data. Note that our analysis may not factor in the latest price-sensitive company announcements or qualitative material. Simply Wall St has no position in any stocks mentioned.
About NasdaqGS:FANG
Diamondback Energy
An independent oil and natural gas company, acquires, develops, explores, and exploits unconventional, onshore oil and natural gas reserves in the Permian Basin in West Texas.
Undervalued with acceptable track record.
Similar Companies
Market Insights

Community Narratives
