Advertisement
- United States
- /
- Oil and Gas
- /
- NasdaqGS:APA
Assessing APA Shares After a 12.7% Weekly Drop and Recent Earnings Outlook

Simply Wall St
Reviewed by Bailey Pemberton
Trying to figure out what to do with APA stock right now? You are in good company. With shares recently closing at $21.94, a lot of investors are trying to make sense of what feels like a rollercoaster of price shifts. Just this past week, APA dropped by 12.7%, a move that has raised eyebrows and caused some to question whether the market is pricing in more risk, or simply overreacting to broad-based energy sector jitters. Looking a bit further back, APA is down 3.9% over the past month and has shed 6.2% since the start of the year, with its one-year performance at -13.6%. Yet, zoom out to the five-year chart and the picture looks very different: APA is up 174.1%. That kind of volatility is enough to make anyone pause before hitting “buy” or “sell.”
But price swings can distract from a company’s actual value. That is why many investors lean on valuation metrics for clarity. As we dig into APA’s numbers, keep in mind the company scores a 5 out of a possible 6 on a comprehensive value check, meaning it looks undervalued by most traditional yardsticks. Of course, those metrics are just the start. Next up, we will break down the specific methods analysts use to judge a stock’s value, and why sometimes, a deeper perspective reveals even more.
Why APA is lagging behind its peers
Approach 1: APA Discounted Cash Flow (DCF) Analysis
The Discounted Cash Flow (DCF) model estimates a company’s value by projecting its future free cash flows and then discounting those amounts back to today’s dollars. This process gives investors a sense of what the business is really worth right now. For APA, the current Free Cash Flow sits at $1.90 billion, with analysts and projections anticipating steady growth over the next decade. By 2029, free cash flow is projected to reach $2.37 billion, and further extrapolations push this figure up to nearly $4.88 billion by 2035.
In this instance, Simply Wall St uses a two-stage Free Cash Flow to Equity DCF, blending analyst forecasts for the next five years with longer-term trend estimates. All figures are presented in US dollars. The outcome of those calculations points to an estimated intrinsic value of $200.50 per share for APA.
Compared to the current market price of $21.94, this means that APA stock is trading at an 89.1% discount to its estimated fair value. Based on this DCF analysis, APA appears significantly undervalued, suggesting there could be considerable upside potential if those cash flow projections are realized.
Result: UNDERVALUED
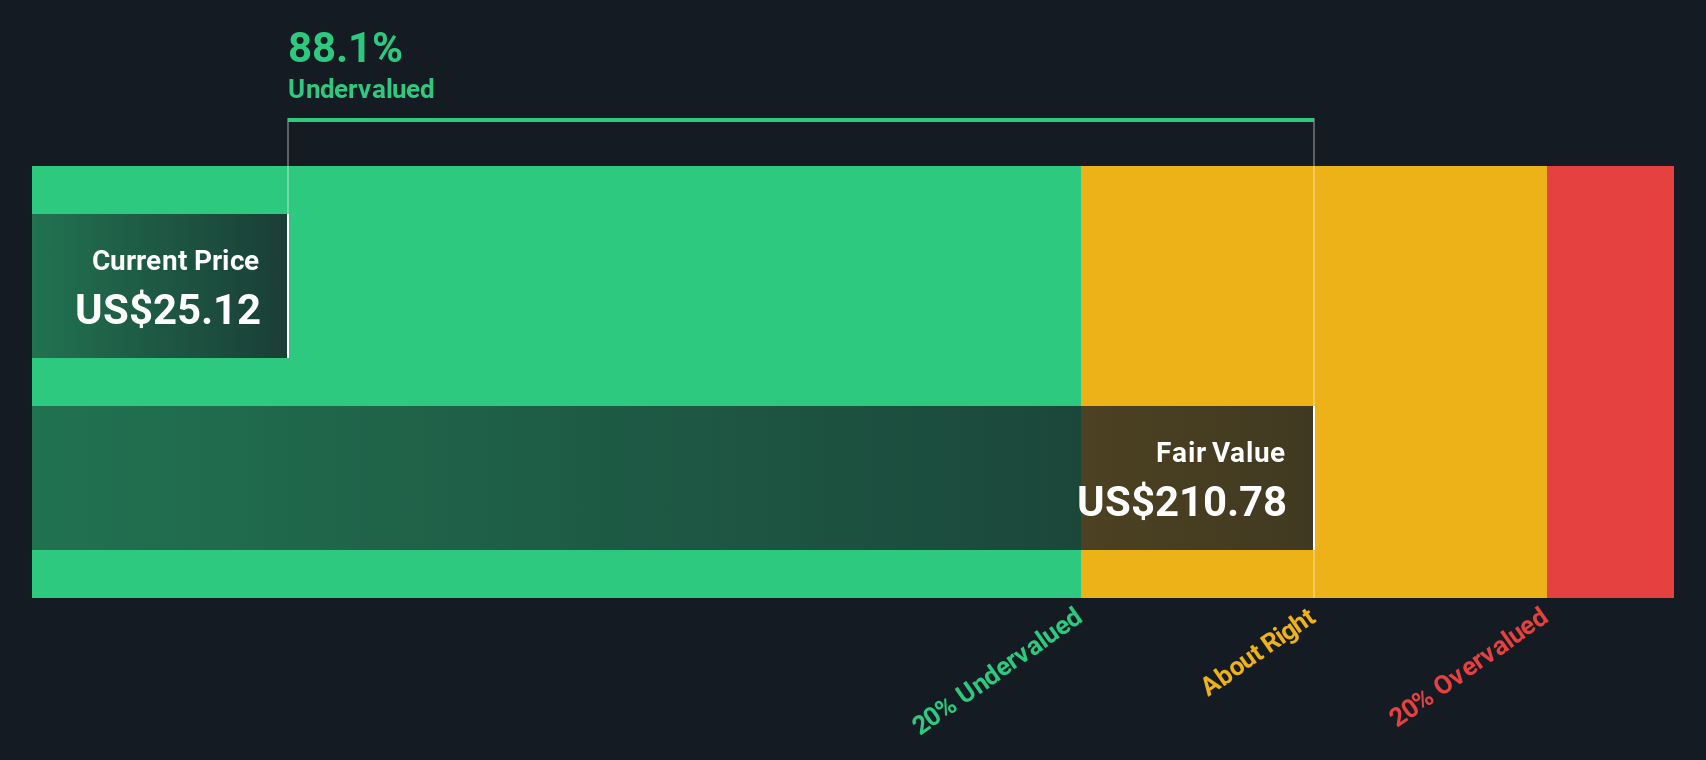
Our Discounted Cash Flow (DCF) analysis suggests APA is undervalued by 89.1%. Track this in your watchlist or portfolio, or discover more undervalued stocks.
Approach 2: APA Price vs Earnings (PE)
For well-established, consistently profitable companies like APA, the price-to-earnings (PE) ratio is one of the most straightforward ways to gauge valuation. This multiple compares a company’s market price to its earnings, providing a clear snapshot of how much investors are paying for each dollar of profit. The PE ratio can vary widely depending on expectations for future growth and perceived risk. Higher growth often justifies a higher PE, while greater risk drives it lower.
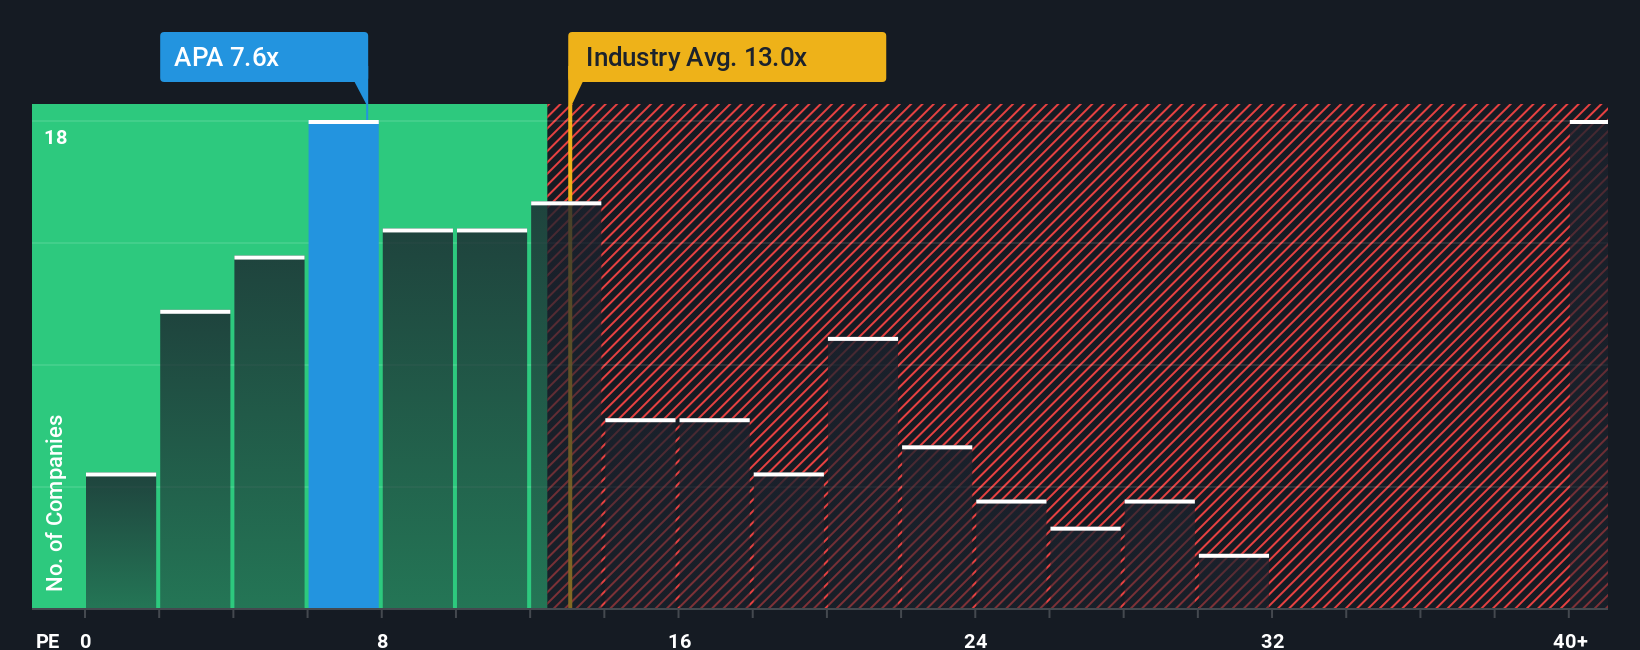
APA currently trades at a PE ratio of 7.26x. This is well below both the Oil and Gas industry average of 13.17x and the peer average of 9.96x. On the surface, APA appears significantly cheaper than most of its competitors, potentially signaling an undervalued opportunity or underlying concerns the market may be factoring in.
A deeper perspective comes from Simply Wall St’s proprietary “Fair Ratio.” This metric calculates the PE you would expect to see for a company like APA, taking into account its earnings growth outlook, industry norms, profit margins, market capitalization, and specific risk factors. This tailored approach offers a more company-specific benchmark, making it more meaningful than simply comparing APA with broad industry or peer averages. For APA, the Fair Ratio is calculated at 15.51x, more than double the company’s current PE.
Since APA’s actual PE is well below its Fair Ratio, this valuation indicator points to the stock being undervalued on an earnings basis, further strengthening the case put forth by the DCF analysis.
Result: UNDERVALUED
PE ratios tell one story, but what if the real opportunity lies elsewhere? Discover companies where insiders are betting big on explosive growth.
Upgrade Your Decision Making: Choose your APA Narrative
Earlier we mentioned that there is an even better way to understand valuation, so let us introduce you to Narratives. A Narrative is more than just a set of numbers; it is your story about a company’s future, connecting your assumptions for fair value, future revenue, earnings, and margins with what is actually happening in the business and industry. Narratives link the company’s story to a detailed financial forecast and estimate what the business is worth today based on those beliefs.
With Simply Wall St’s Narratives tool, found on the Community page used by millions of investors, you can build your own perspective or explore others’ views, all in one place. Narratives help you decide when to buy or sell by clearly showing the gap between Fair Value and the current share Price, dynamically updating as new earnings news or market developments roll in.
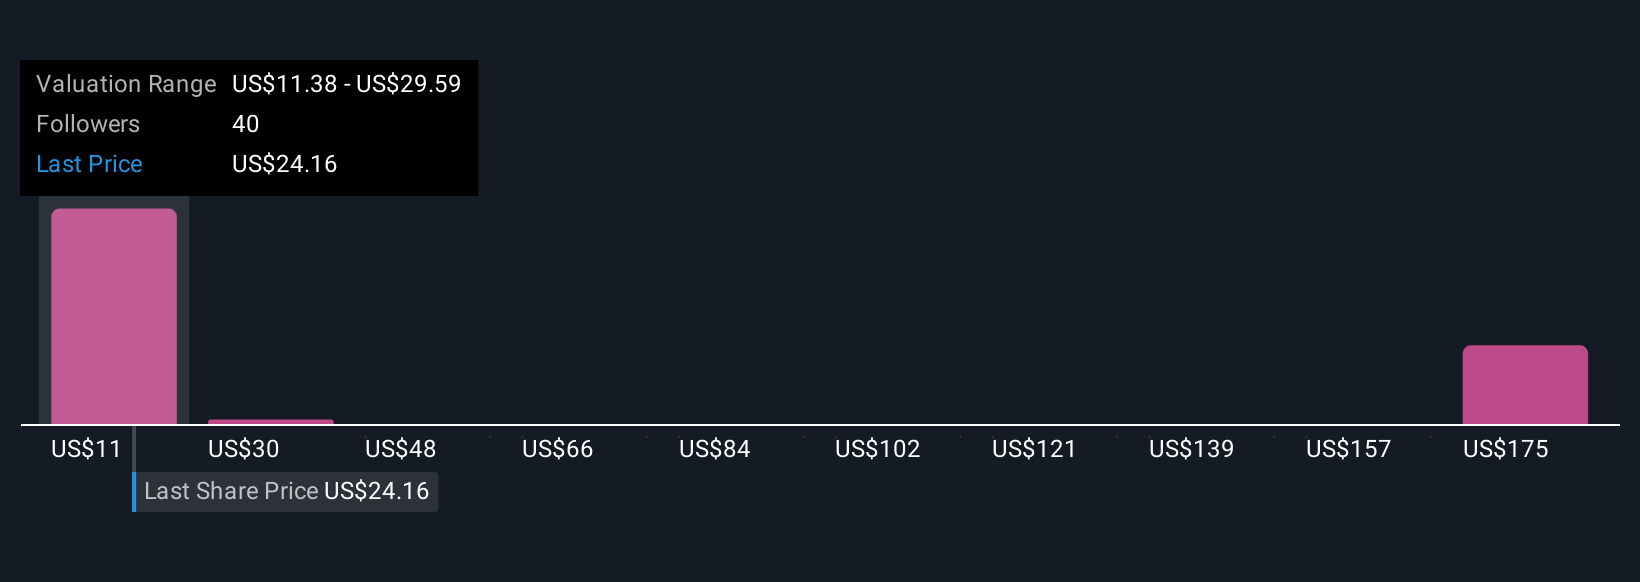
For example, some APA Narratives see future gains driven by operational efficiencies in Egypt and the Permian, resulting in a fair value as high as $35 per share, while others take a more cautious view, citing sector risks and forecasting a fair value closer to $16. Narratives empower you to see and understand these perspectives at a glance, so you can make smarter, story-based investment decisions.
Do you think there's more to the story for APA? Create your own Narrative to let the Community know!
This article by Simply Wall St is general in nature. We provide commentary based on historical data and analyst forecasts only using an unbiased methodology and our articles are not intended to be financial advice. It does not constitute a recommendation to buy or sell any stock, and does not take account of your objectives, or your financial situation. We aim to bring you long-term focused analysis driven by fundamental data. Note that our analysis may not factor in the latest price-sensitive company announcements or qualitative material. Simply Wall St has no position in any stocks mentioned.
New: Manage All Your Stock Portfolios in One Place
We've created the ultimate portfolio companion for stock investors, and it's free.
• Connect an unlimited number of Portfolios and see your total in one currency
• Be alerted to new Warning Signs or Risks via email or mobile
• Track the Fair Value of your stocks
Have feedback on this article? Concerned about the content? Get in touch with us directly. Alternatively, email editorial-team@simplywallst.com
About NasdaqGS:APA
APA
An independent energy company, explores for, develops, and produces natural gas, crude oil, and natural gas liquids.
Undervalued average dividend payer.
Similar Companies
Market Insights

Advertisement
Community Narratives
A formidable player in AI and enterprise computing.
Fair Value US$210.00|2.3% overvalued
CO
Community Contributor
IREN's Bold Moves in Sustainable Bitcoin Mining & AI Data Centers
Fair Value US$72.52|17.6% undervalued
BL
Community Contributor
Cooling the Champions: The Aussie Tech Behind F1's Victories
Fair Value AU$12.40|40.4% undervalued
TR
Community Contributor