Advertisement
- United States
- /
- Diversified Financial
- /
- NYSE:WEX
Is Now the Right Moment for WEX Shares After 25% Slide and Uncertain Outlook?

Simply Wall St
Reviewed by Bailey Pemberton
If you own WEX stock, or you are considering a position, recent volatility may leave you weighing short-term uncertainty against long-term potential. WEX’s share price has had a turbulent year, falling 9.5% year-to-date and over 24% compared to twelve months ago. In the last month, shares have declined another 7.5%. While these figures might prompt some quick decisions, it is worth noting that the stock still shows a 14.7% positive return over the past three years, indicating resilience during challenging periods.
Much of WEX’s recent price movement is influenced by broader market developments, especially shifts in risk perception across financial and payment processing stocks. Investors are evaluating the company’s growth outlook within these changing market dynamics. If you are questioning whether the market is being too harsh on WEX, or if the recent dips represent a potential opportunity, you are not alone.
To establish a foundation before making any significant decisions, consider the numbers. By a basic valuation score, where WEX is viewed as undervalued in 3 out of 6 key checks, the company stands at roughly the halfway mark. However, traditional valuation checks reveal only part of the picture. In the next section, the main approaches for assessing whether WEX is undervalued, fairly priced, or facing further downside will be examined. By the end, an even more insightful perspective on WEX’s value will be introduced.
Why WEX is lagging behind its peers
Approach 1: WEX Excess Returns Analysis
The Excess Returns model evaluates a company's ability to generate returns on equity above the cost of capital, offering a focused look at WEX’s profitability and growth prospects over time. For WEX, this approach is based on several forward-looking estimates and averages from analysts covering its underlying business fundamentals.
WEX currently has a Book Value of $28.53 per share and an impressive Stable Earnings Per Share (EPS) of $19.24, based on weighted future Return on Equity estimates from five analysts. The company's Cost of Equity stands at $4.27 per share, meaning WEX generates an annual Excess Return of $14.97 per share over what investors require for their capital. Over the long run, its Average Return on Equity is projected at 42.97%. This is a strong indicator that WEX can continue to outperform its baseline capital requirements. Stable Book Value is estimated at $44.78 per share, according to four analyst estimates.
Based on these calculations, the Excess Returns model estimates WEX’s intrinsic value at $276.58 per share, which is 42.7% above its current market price. This large discount suggests the company’s shares are undervalued according to this method.
Result: UNDERVALUED
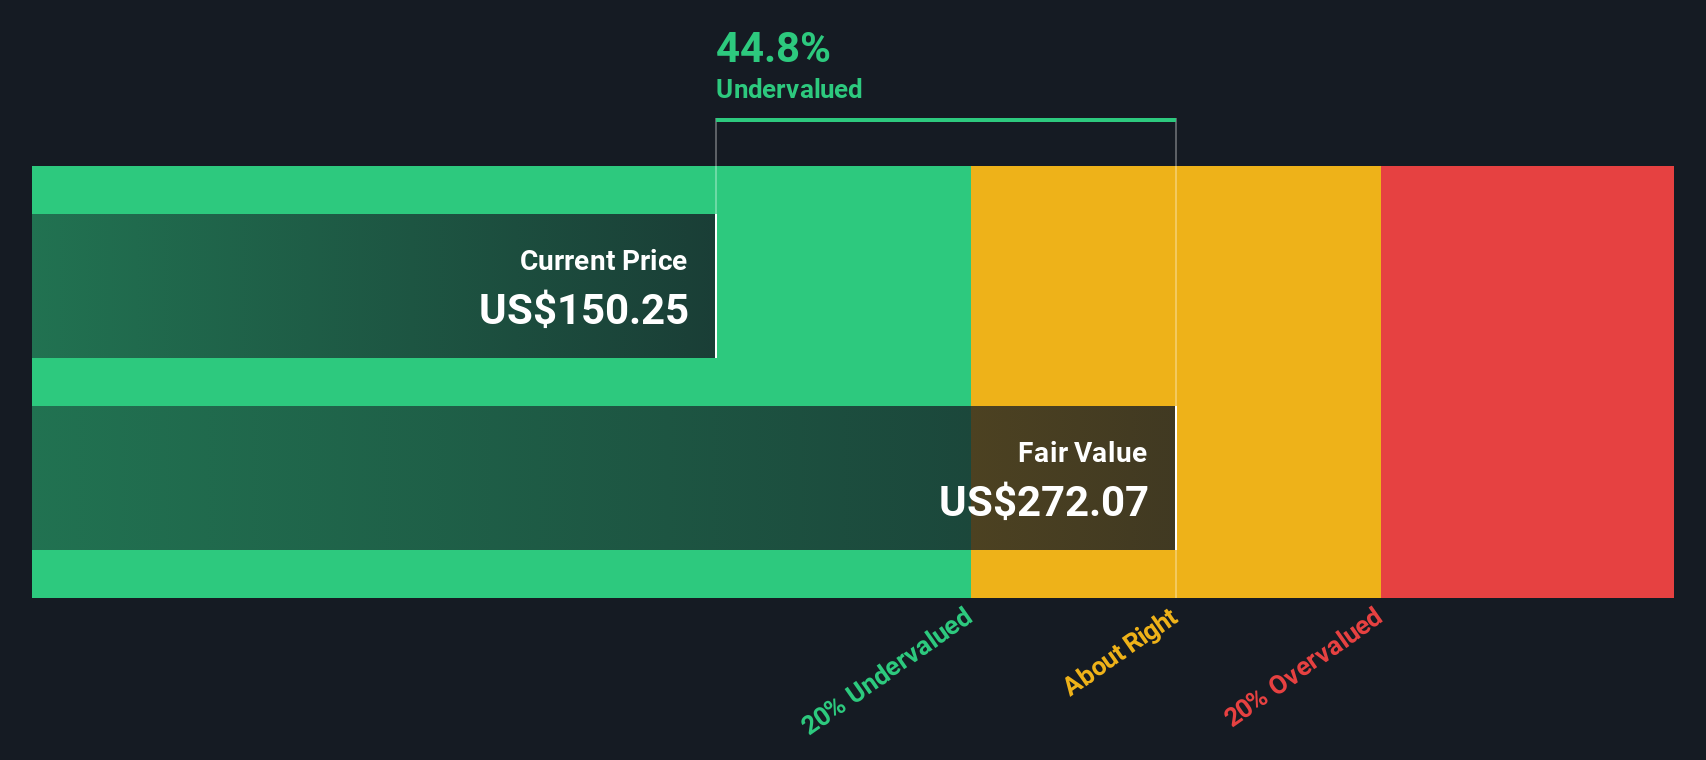
Our Excess Returns analysis suggests WEX is undervalued by 42.7%. Track this in your watchlist or portfolio, or discover more undervalued stocks.
Approach 2: WEX Price vs Earnings
For profitable companies like WEX, the Price-to-Earnings (PE) ratio is one of the most widely used valuation metrics because it compares a stock’s market price to its actual earnings power. A company generating consistent profits gives investors a solid baseline for assessing whether the current share price offers good value for its earnings.
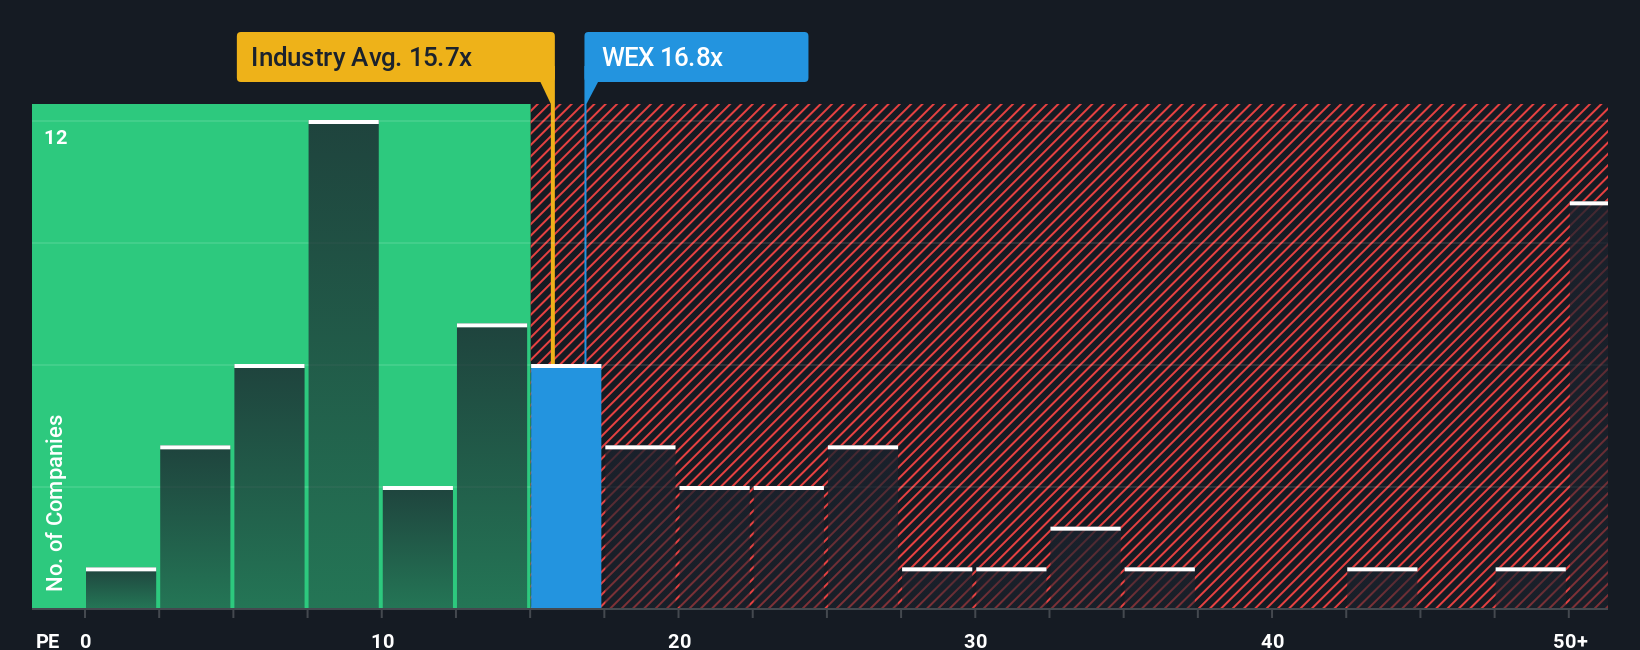
The “right” PE ratio depends on a mix of growth expectations and risks. Generally, faster-growing and lower-risk companies command higher PE ratios, while slower-growing or riskier firms tend to trade at lower multiples. Today, WEX trades at a PE ratio of 17.7x. This is slightly above the Diversified Financial industry average of 16.1x, but below the average of its most comparable peers at 20.7x. This places WEX in the middle of the pack, neither priced aggressively nor at a clear discount based solely on these traditional benchmarks.
However, a more tailored approach comes from Simply Wall St’s proprietary “Fair Ratio,” which calculates the PE you’d expect for WEX after considering its growth prospects, profit margin, industry, size, and risk profile. For WEX, the Fair Ratio stands at 16.8x. This number goes beyond basic comparisons and offers a nuanced perspective suited to the company’s unique characteristics. Since WEX's actual PE ratio is only about 0.9x higher than its Fair Ratio, the stock appears to be priced almost exactly where it should be, factoring in all relevant variables.
Result: ABOUT RIGHT
PE ratios tell one story, but what if the real opportunity lies elsewhere? Discover companies where insiders are betting big on explosive growth.
Upgrade Your Decision Making: Choose your WEX Narrative
Earlier we mentioned that there is an even better way to understand valuation, so let's introduce you to Narratives. A Narrative is simply a way for you to add your own story to the numbers by connecting what you believe about WEX’s future, such as its revenue, earnings growth, business trends, and risks, with a fair value estimate based on those assumptions.
Narratives help you tie together your view of the company (for example, believing WEX will accelerate digital payments through partnership deals and tech innovation) with supporting financial forecasts, making your investment logic transparent and actionable. They make investing more approachable for anyone, as you can try them out on the Simply Wall St Community page, allowing you to see and compare other investors’ perspectives and understand how they arrive at different fair values.
With Narratives, you can quickly see if your estimate of WEX’s Fair Value signals “Buy” or “Sell” versus the current price, and your forecasts update automatically the moment new news, earnings, or data is available. For instance, some investors base their forecasts on aggressive digital payments growth and assign a fair value up at $276, while others see industry risks and project a more conservative $184 fair value. Narratives empower you to reach a smarter, more personalized investment decision, rooted in both data and your unique viewpoint.
Do you think there's more to the story for WEX? Create your own Narrative to let the Community know!
This article by Simply Wall St is general in nature. We provide commentary based on historical data and analyst forecasts only using an unbiased methodology and our articles are not intended to be financial advice. It does not constitute a recommendation to buy or sell any stock, and does not take account of your objectives, or your financial situation. We aim to bring you long-term focused analysis driven by fundamental data. Note that our analysis may not factor in the latest price-sensitive company announcements or qualitative material. Simply Wall St has no position in any stocks mentioned.
Valuation is complex, but we're here to simplify it.
Discover if WEX might be undervalued or overvalued with our detailed analysis, featuring fair value estimates, potential risks, dividends, insider trades, and its financial condition.
Access Free AnalysisHave feedback on this article? Concerned about the content? Get in touch with us directly. Alternatively, email editorial-team@simplywallst.com
About NYSE:WEX
WEX
Operates a commerce platform in the United States and internationally.
Proven track record and fair value.
Similar Companies
Market Insights

Advertisement
Community Narratives
The Next Phase of Energy Storage: How NeoVolta Is Tackling America’s Power Crunch
Fair Value US$7.50|30.4% undervalued
MA
Community Contributor
A formidable player in AI and enterprise computing.
Fair Value US$210.00|3.0% undervalued
CO
Community Contributor
IREN's Bold Moves in Sustainable Bitcoin Mining & AI Data Centers
Fair Value US$72.52|20.4% undervalued
BL
Community Contributor
Cooling the Champions: The Aussie Tech Behind F1's Victories
Fair Value AU$12.40|38.1% undervalued
TR
Community Contributor