Advertisement
- United States
- /
- Capital Markets
- /
- NYSE:VRTS
Virtus Investment Partners (VRTS): Evaluating Valuation After Latest Assets Under Management Update

Simply Wall St
Reviewed by Kshitija Bhandaru
Virtus Investment Partners (VRTS) just released its latest update on assets under management, providing investors with an early look at the firm’s business trends ahead of the upcoming financial results.
See our latest analysis for Virtus Investment Partners.
The early look at Virtus’s assets under management comes at a time when its stock has faced pressure, with the share price sliding 12.5% so far this year and total shareholder return down 9.8% over the last twelve months. While the short-term momentum has faded a bit, long-term investors will note the stock has still delivered over 40% total return in the past three years. This may point to underlying growth potential even as the market weighs near-term challenges and shifting client flows.
If recent market moves have you exploring what else is out there, now is a perfect moment to broaden your search and discover fast growing stocks with high insider ownership
With shares lately under pressure while the company has demonstrated a solid track record over the past three years, the key question is whether Virtus is currently undervalued or if the market has already priced in any future upside.
Price-to-Earnings of 8.9x: Is it justified?
Virtus Investment Partners is currently trading at a price-to-earnings (P/E) ratio of 8.9x, a figure notably below both its peer group and the broader industry average. With a last close at $191.81 per share, this suggests the market is assigning a significant valuation discount to the company's recent earnings performance.
The price-to-earnings ratio measures how much investors are paying for each dollar of company earnings. It is a critical gauge for asset managers like Virtus, where earnings stability and growth prospects underpin share price potential. The low P/E could signal the market's skepticism regarding future profitability or reflect headwinds unique to the sector.
Notably, Virtus's P/E sits well below the peer average of 28.8x and the US Capital Markets industry average of 25.8x. This substantial discount highlights that, compared to its competitors, Virtus may be underappreciated by investors on current earnings. If the company's business stabilizes or improves, the P/E could move closer to industry levels.
See what the numbers say about this price — find out in our valuation breakdown.
Result: Price-to-Earnings of 8.9x (UNDERVALUED)
However, slowing annual revenue growth and recent share price declines could pose challenges for Virtus if these trends continue or worsen in the coming quarters.
Find out about the key risks to this Virtus Investment Partners narrative.
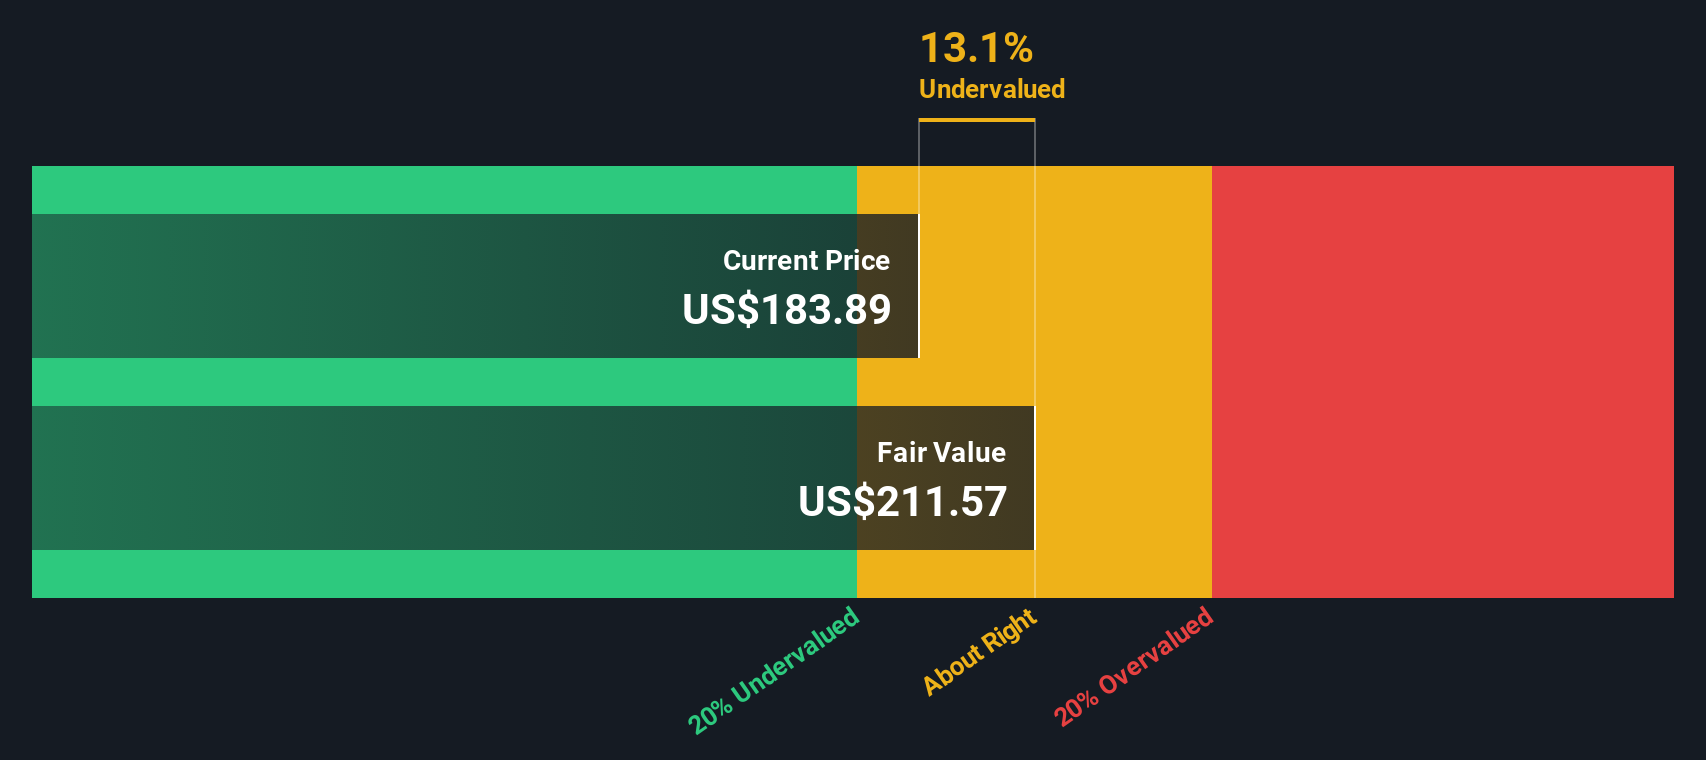
Another View: Discounted Cash Flow Perspective
Looking at Virtus Investment Partners from the perspective of our SWS DCF model provides a different angle on valuation. This method estimates the company’s true worth based on future cash flows. In this case, it suggests that Virtus shares are trading below fair value. Does this mean the potential upside is greater than the market thinks, or could risks keep the stock subdued?
Look into how the SWS DCF model arrives at its fair value.
Simply Wall St performs a discounted cash flow (DCF) on every stock in the world every day (check out Virtus Investment Partners for example). We show the entire calculation in full. You can track the result in your watchlist or portfolio and be alerted when this changes, or use our stock screener to discover undervalued stocks based on their cash flows. If you save a screener we even alert you when new companies match - so you never miss a potential opportunity.
Build Your Own Virtus Investment Partners Narrative
If you see these trends differently or prefer to dive into the numbers on your own, you can easily craft your own analysis in just a few minutes with Do it your way.
A great starting point for your Virtus Investment Partners research is our analysis highlighting 2 key rewards and 1 important warning sign that could impact your investment decision.
Looking for more investment ideas?
Don’t let opportunities pass you by. Harness the power of the Simply Wall Street Screener to spot unique, high-potential investments tailored to your goals.
- Jump into fast-growing, resilient businesses by checking out these 871 undervalued stocks based on cash flows, which targets stocks where the market may have overlooked true value.
- Tap into the future of healthcare innovation by exploring these 33 healthcare AI stocks, highlighting those revolutionizing patient care with artificial intelligence.
- Unlock the potential of cryptocurrency and blockchain markets through these 79 cryptocurrency and blockchain stocks, showcasing companies at the forefront of digital finance and technology transformation.
This article by Simply Wall St is general in nature. We provide commentary based on historical data and analyst forecasts only using an unbiased methodology and our articles are not intended to be financial advice. It does not constitute a recommendation to buy or sell any stock, and does not take account of your objectives, or your financial situation. We aim to bring you long-term focused analysis driven by fundamental data. Note that our analysis may not factor in the latest price-sensitive company announcements or qualitative material. Simply Wall St has no position in any stocks mentioned.
New: Manage All Your Stock Portfolios in One Place
We've created the ultimate portfolio companion for stock investors, and it's free.
• Connect an unlimited number of Portfolios and see your total in one currency
• Be alerted to new Warning Signs or Risks via email or mobile
• Track the Fair Value of your stocks
Have feedback on this article? Concerned about the content? Get in touch with us directly. Alternatively, email editorial-team@simplywallst.com
About NYSE:VRTS
Solid track record established dividend payer.
Similar Companies
Market Insights

Advertisement
Community Narratives
A formidable player in AI and enterprise computing.
Fair Value US$210.00|13.6% overvalued
CO
Community Contributor
IREN's Bold Moves in Sustainable Bitcoin Mining & AI Data Centers
Fair Value US$89.00|23.6% undervalued
BL
Community Contributor
Cooling the Champions: The Aussie Tech Behind F1's Victories
Fair Value AU$12.40|40.6% undervalued
TR
Community Contributor