Advertisement
- United States
- /
- Capital Markets
- /
- NYSE:SPGI
A Look at S&P Global's (SPGI) Valuation Following AI Partnership and Digital Asset Index Launch

Simply Wall St
Reviewed by Kshitija Bhandaru
S&P Global (SPGI) has made headlines with two big moves: partnering with IBM to roll out AI-powered supply chain solutions and launching the S&P Digital Markets 50 Index, which brings traditional finance and digital assets together in a new way.
See our latest analysis for S&P Global.
S&P Global has been in the spotlight lately for good reason, but the stock’s journey has hit a few bumps. Following recent innovation news, the 1-day share price slipped 0.31% and the past month saw a notable 9.96% share price pullback. Despite this, long-term holders can still point to robust gains, with three-year total shareholder returns up nearly 74% and five-year returns topping 45%. This suggests that momentum may be regrouping after a period of outperformance and valuation debate.
If S&P Global’s push into AI and digital finance got your attention, now's a great time to see what else is evolving in the market and discover fast growing stocks with high insider ownership
The question now is whether S&P Global’s recent dip signals an undervalued opportunity for long-term investors, or if the market has already factored in all the growth from these bold new initiatives.
Price-to-Earnings of 37x: Is it justified?
S&P Global trades at a price-to-earnings ratio of 37x, which stands well above both peer and industry averages. This premium suggests the market is expecting strong future growth and profitability, but investors may be paying a steep price for anticipated performance.
The price-to-earnings ratio gauges how much investors are willing to pay today for a dollar of earnings. In the capital markets sector, it is a key measure of confidence in a company’s earnings trajectory and quality. For S&P Global, this elevated multiple highlights the company’s established track record and perceived resilience. However, it also puts pressure on future results to justify such a valuation.
Compared to the US Capital Markets industry average of 24.9x and a peer group average of 32.3x, S&P Global is even more expensive. Notably, its multiple is also much higher than the estimated fair price-to-earnings ratio of 20.2x. This level is what our models suggest may be more sustainable if the growth outlook moderates or competitive pressures increase.
Explore the SWS fair ratio for S&P Global
Result: Price-to-Earnings of 37x (OVERVALUED)
However, slowing revenue growth and recent share price weakness could signal headwinds ahead. This may challenge optimistic forecasts for S&P Global’s future returns.
Find out about the key risks to this S&P Global narrative.
Another View: What Does Our DCF Model Say?
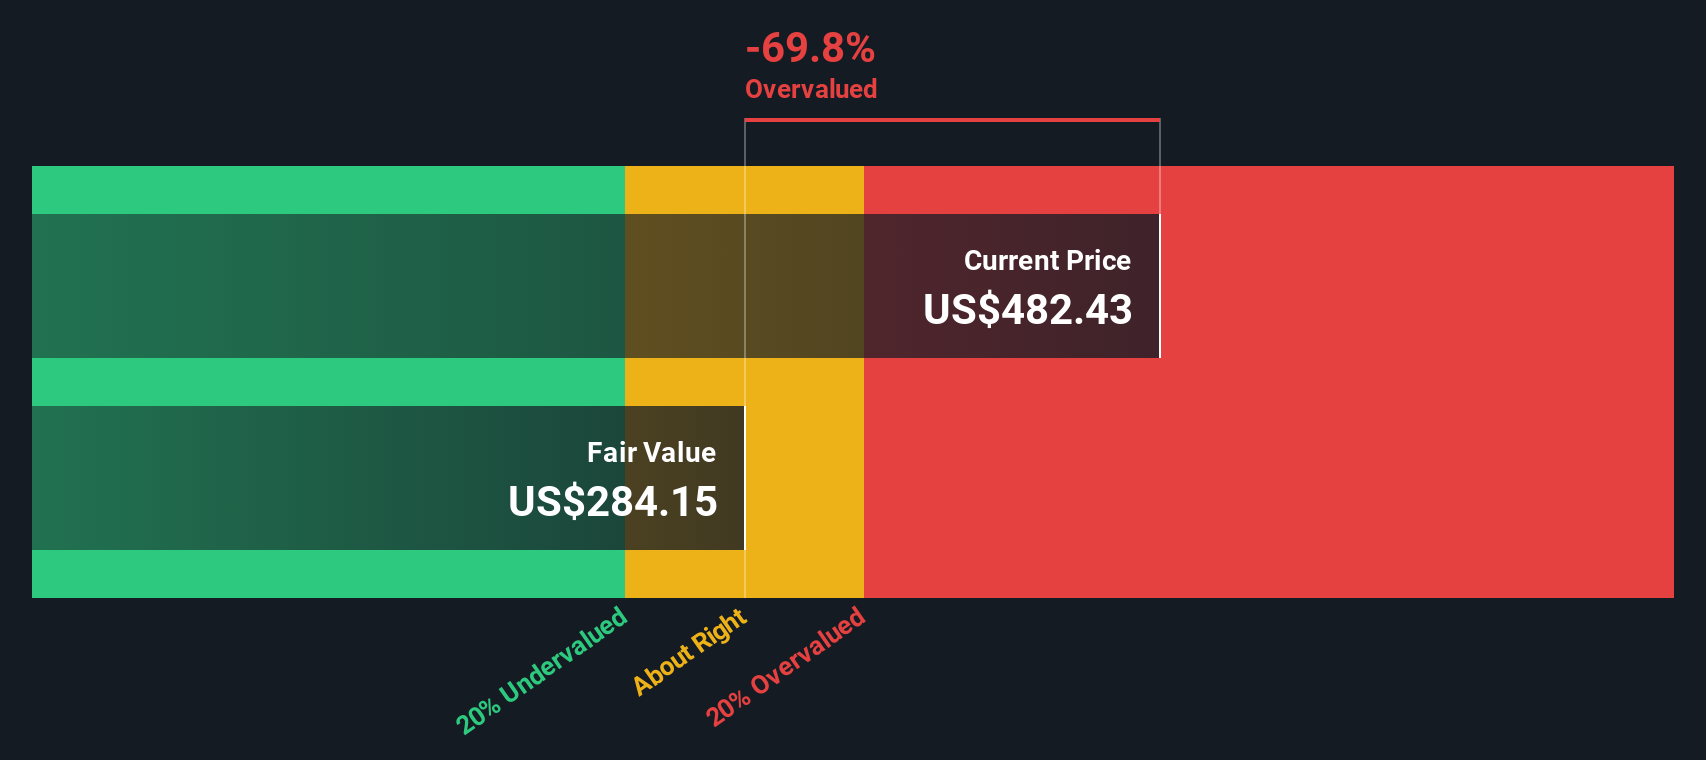
Looking from another angle, the Simply Wall St DCF model values S&P Global at $284.77 per share. This figure is well below the current price of $486.10. According to this method, the stock could be overvalued. Can market optimism overcome this gap, or is caution warranted?
Look into how the SWS DCF model arrives at its fair value.
Simply Wall St performs a discounted cash flow (DCF) on every stock in the world every day (check out S&P Global for example). We show the entire calculation in full. You can track the result in your watchlist or portfolio and be alerted when this changes, or use our stock screener to discover undervalued stocks based on their cash flows. If you save a screener we even alert you when new companies match - so you never miss a potential opportunity.
Build Your Own S&P Global Narrative
If you have a different perspective or want to see how the numbers stack up for yourself, you can quickly build your own view in minutes: Do it your way
A great starting point for your S&P Global research is our analysis highlighting 3 key rewards and 1 important warning sign that could impact your investment decision.
Looking for More Investment Ideas?
Staying ahead means acting on fresh opportunities before everyone else. Level up your investing game by checking out these handpicked stock ideas built on proven strategies:
- Boost your passive income by tapping into higher yields. Unlock the full list of standouts with these 19 dividend stocks with yields > 3%.
- Capture growth potential in trailblazing industries by scanning these 24 AI penny stocks, paving the way in machine learning and automation.
- Position yourself for value gains by targeting strong companies trading below their potential, all inside these 898 undervalued stocks based on cash flows.
This article by Simply Wall St is general in nature. We provide commentary based on historical data and analyst forecasts only using an unbiased methodology and our articles are not intended to be financial advice. It does not constitute a recommendation to buy or sell any stock, and does not take account of your objectives, or your financial situation. We aim to bring you long-term focused analysis driven by fundamental data. Note that our analysis may not factor in the latest price-sensitive company announcements or qualitative material. Simply Wall St has no position in any stocks mentioned.
New: Manage All Your Stock Portfolios in One Place
We've created the ultimate portfolio companion for stock investors, and it's free.
• Connect an unlimited number of Portfolios and see your total in one currency
• Be alerted to new Warning Signs or Risks via email or mobile
• Track the Fair Value of your stocks
Have feedback on this article? Concerned about the content? Get in touch with us directly. Alternatively, email editorial-team@simplywallst.com
About NYSE:SPGI
S&P Global
Provides credit ratings, benchmarks, analytics, and workflow solutions in the global capital, commodity, and automotive markets.
Solid track record with adequate balance sheet and pays a dividend.
Similar Companies
Market Insights

Advertisement
Community Narratives
A formidable player in AI and enterprise computing.
Fair Value US$210.00|12.2% overvalued
CO
Community Contributor
IREN's Bold Moves in Sustainable Bitcoin Mining & AI Data Centers
Fair Value US$72.52|17.1% undervalued
BL
Community Contributor
Cooling the Champions: The Aussie Tech Behind F1's Victories
Fair Value AU$12.40|38.7% undervalued
TR
Community Contributor