Advertisement
- United States
- /
- Capital Markets
- /
- NYSE:PX
Assessing P10 After 15% Drop and Recent Earnings Update in 2025

Simply Wall St
Reviewed by Bailey Pemberton
Trying to figure out what’s next for P10? You’re not alone. Investors have watched the stock navigate ups and downs this year, with a recent close at $10.89. In the past week alone, P10 slipped by 2.6%, extending a larger 30-day decline of 9.5%. Year-to-date, shares are down by 15.2%, yet over the past year the decline appears less dramatic, with a 0.4% gain. Looking at a three-year perspective, the stock has increased by 8.4% overall.
What is driving these moves? Market sentiment around alternative asset managers like P10 has shifted as investors reconsider broader risks and growth opportunities in the financial sector, not just for P10 but across the industry. Some optimism persists due to long-term business trends, yet a more cautious mood has emerged, especially as the market considers potential headwinds.
How does P10 look from a valuation perspective? By the current numbers, it may not appear to be a bargain. Out of a possible six key valuation checks, P10 is considered undervalued in none of them, resulting in a valuation score of zero. Before drawing any conclusions, though, the full picture becomes clearer when examining how these valuation methods function and why a more nuanced approach to understanding value could be important going forward.
P10 scores just 0/6 on our valuation checks. See what other red flags we found in the full valuation breakdown.
Approach 1: P10 Excess Returns Analysis
The Excess Returns model evaluates a company's ability to generate returns above its cost of equity. In simple terms, it looks at how much profit P10 can produce from its invested capital, after accounting for the cost of funding that capital. This model is a useful way to measure whether the business is truly creating additional value for shareholders in the long run.
For P10, the key metrics from this approach are:
- Book Value: $3.07 per share
- Stable EPS: $0.18 per share (Source: Median Return on Equity from the past 5 years.)
- Cost of Equity: $0.40 per share
- Excess Return: $-0.22 per share
- Average Return on Equity: 3.96%
- Stable Book Value: $4.44 per share (Source: Weighted future Book Value estimates from 2 analysts.)
These numbers indicate P10 is not currently generating positive excess returns, with the average return on equity lagging behind its cost of equity. As a result, the estimated intrinsic value from this model is significantly below the current share price. This signals that the stock is roughly 1551.1% overvalued based on these metrics.
Result: OVERVALUED
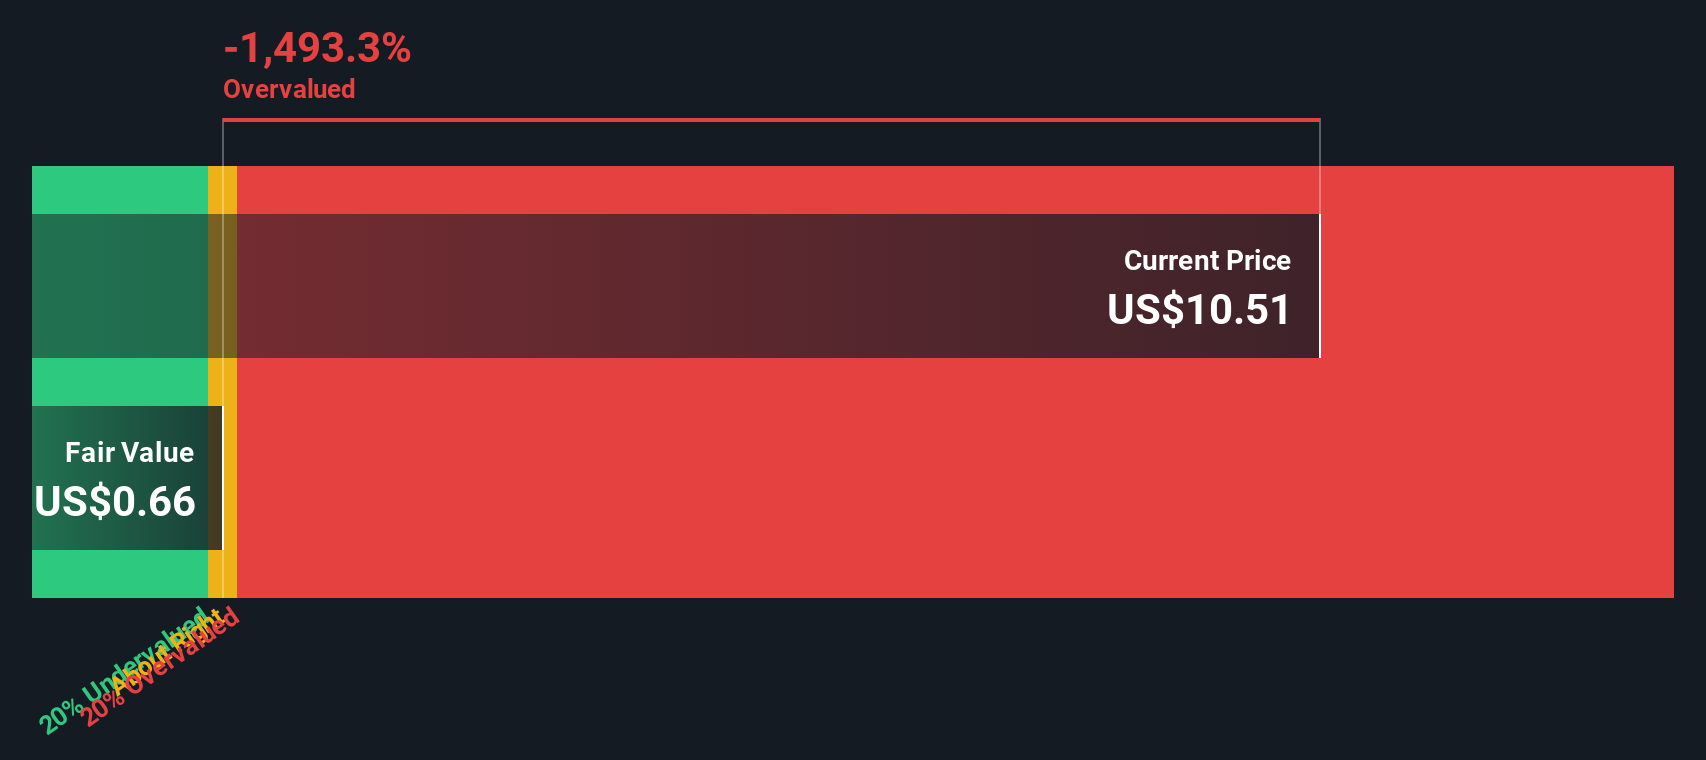
Our Excess Returns analysis suggests P10 may be overvalued by 1551.1%. Find undervalued stocks or create your own screener to find better value opportunities.
Approach 2: P10 Price vs Earnings
The price-to-earnings (PE) ratio is a widely used valuation metric for profitable companies, as it helps investors assess how much they are paying for each dollar of earnings. In profitable firms such as P10, the PE ratio is particularly relevant because it ties the stock price directly to underlying earnings and provides a useful gauge for value.
However, what counts as a "fair" or "normal" PE ratio is not set in stone. Expectations of future growth as well as the risk level associated with a company's business play a major role. Generally, higher growth and lower risk justify a higher PE ratio, while companies with uncertain outlooks or greater risks should trade on lower multiples.
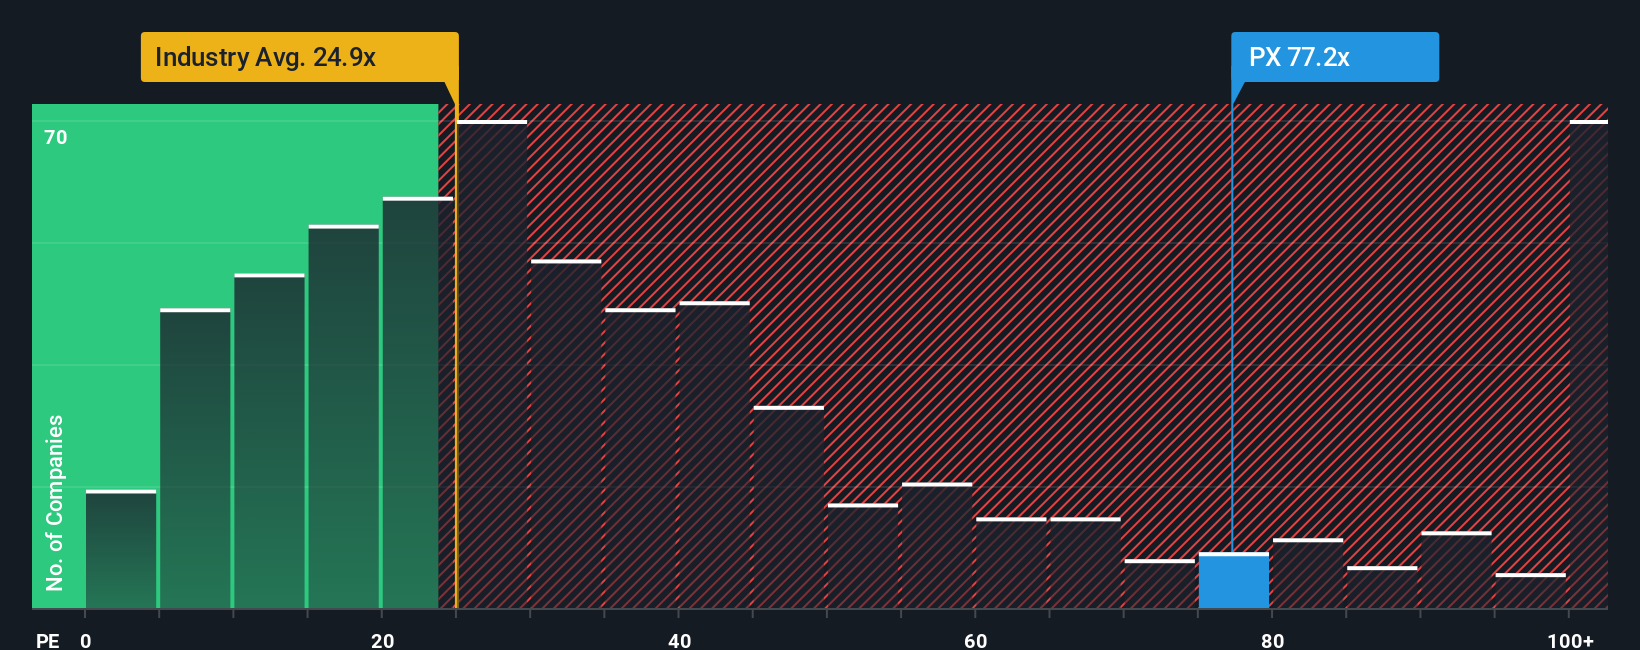
P10 currently trades at a PE ratio of 82x, which is substantially higher than both the Capital Markets industry average of 27.07x and its peer group average of 8.11x. At first glance, this suggests the stock is valued well above its immediate comparables and raises questions about whether such a premium is justified by growth or quality.
This is where Simply Wall St’s proprietary Fair Ratio comes in. Unlike basic peer or industry comparisons, the Fair Ratio is customized to incorporate P10’s earnings growth prospects, industry context, risk factors, profit margins, and market capitalization. This comprehensive perspective aims to provide a more tailored benchmark for what the company should be worth, rather than just where its peers are trading. Without a Fair Ratio significantly different from its current PE, and with an 82x ratio far above the norms, P10 appears overvalued through this lens as well.
Result: OVERVALUED
PE ratios tell one story, but what if the real opportunity lies elsewhere? Discover companies where insiders are betting big on explosive growth.
Upgrade Your Decision Making: Choose your P10 Narrative
Earlier we mentioned that there is an even better way to understand valuation, so let's introduce you to Narratives. A Narrative is your interpretation of P10’s story, letting you connect company events and strategies to a financial forecast and an estimated fair value. Rather than just following the numbers, Narratives help you make sense of them by weighing your assumptions about future revenue, earnings, and margins to generate a personalized view of what the company is really worth.
On Simply Wall St’s Community page, Narratives are a powerful and accessible tool, used by millions of investors, that lets you track your investment thesis alongside live data and updated company news. Each Narrative creates a direct link between your outlook and a fair value estimate, so you can instantly see if the current price offers an opportunity or a risk.
What’s more, Narratives update automatically when new information comes in, such as quarterly results or major announcements, helping you quickly assess whether your investment view still holds or needs to change. For P10, some investors expect aggressive international growth and assign a fair value as high as $18.00. Others see risk in margin pressures and rate it at just $12.00, making Narratives a flexible tool for every perspective.
Do you think there's more to the story for P10? Create your own Narrative to let the Community know!
This article by Simply Wall St is general in nature. We provide commentary based on historical data and analyst forecasts only using an unbiased methodology and our articles are not intended to be financial advice. It does not constitute a recommendation to buy or sell any stock, and does not take account of your objectives, or your financial situation. We aim to bring you long-term focused analysis driven by fundamental data. Note that our analysis may not factor in the latest price-sensitive company announcements or qualitative material. Simply Wall St has no position in any stocks mentioned.
New: Manage All Your Stock Portfolios in One Place
We've created the ultimate portfolio companion for stock investors, and it's free.
• Connect an unlimited number of Portfolios and see your total in one currency
• Be alerted to new Warning Signs or Risks via email or mobile
• Track the Fair Value of your stocks
Have feedback on this article? Concerned about the content? Get in touch with us directly. Alternatively, email editorial-team@simplywallst.com
About NYSE:PX
P10
Operates as a multi-asset class private market solutions provider in the alternative asset management industry in the United States.
Slight risk with acceptable track record.
Similar Companies
Market Insights

Advertisement
Community Narratives
A formidable player in AI and enterprise computing.
Fair Value US$210.00|3.1% overvalued
CO
Community Contributor
IREN's Bold Moves in Sustainable Bitcoin Mining & AI Data Centers
Fair Value US$72.52|11.6% undervalued
BL
Community Contributor
Cooling the Champions: The Aussie Tech Behind F1's Victories
Fair Value AU$12.40|40.4% undervalued
TR
Community Contributor