Advertisement
- United States
- /
- Capital Markets
- /
- NYSE:MS
Is Morgan Stanley’s 26.7% 2025 Rally Sustainable After Latest Wealth Management Moves?

Simply Wall St
Reviewed by Bailey Pemberton
If you have been eyeing Morgan Stanley’s stock lately, you are not alone. Investors are weighing whether its sharp multi-year climb means it is time to take profits or if there is more room to run. Over just five years, the stock has generated an impressive 290.4% return, comfortably outpacing most of its peers and riding the wave of surging market confidence. Even this year, Morgan Stanley boasts a 26.7% gain year-to-date, despite some choppiness and a recent pullback of 2.8% in the last week. With these kinds of numbers, it is no wonder people are debating how much further the stock can realistically go.
There are some key stories gently nudging the stock price along. Recent headlines around strategic investments in wealth management and steady growth in assets under management have reinforced perceptions that Morgan Stanley is positioning itself well for the future. On the flip side, occasional flare-ups in global banking concerns have prompted very short-term jitters, reflected in recent minor price dips. Overall, the narrative lately has shifted to focus more on long-term, structural strength rather than fleeting risks.
So, where does the valuation stand now with all these developments? Using six widely watched valuation checks, Morgan Stanley scores a 3, meaning it appears undervalued in half of the common measures analysts look to. But numbers only tell part of the story. Let’s break down the standard valuation approaches, and then, stick around as we explore an even deeper perspective on what this score really means for investors like you.
Approach 1: Morgan Stanley Excess Returns Analysis
The Excess Returns model estimates a company’s true value by focusing on how much profit it earns above the minimum required by its shareholders. In other words, it examines the return Morgan Stanley gets on its investments after accounting for the cost of equity and then projects how those excess returns grow over time. This approach is especially relevant for financial companies that can consistently generate strong returns on their capital.
According to the model, Morgan Stanley’s book value stands at $61.59 per share, with a projected stable EPS of $11.00 per share based on future Return on Equity estimates from 13 analysts. The average return on equity is 16.21%, and the cost of equity is $6.62 per share. That means excess returns reach $4.38 per share, a solid margin showing Morgan Stanley’s capacity to add value for its shareholders. Furthermore, the stable book value is anticipated to edge up to $67.87 per share, reflecting ongoing growth supported by 14 analysts’ forecasts.
Taking all these factors into account, the model calculates an intrinsic value of $133.44 per share. Compared to the current share price, this suggests Morgan Stanley is about 18.5% overvalued right now, signaling that the recent rally may have pushed the price ahead of its fundamentals for the time being.
Result: OVERVALUED
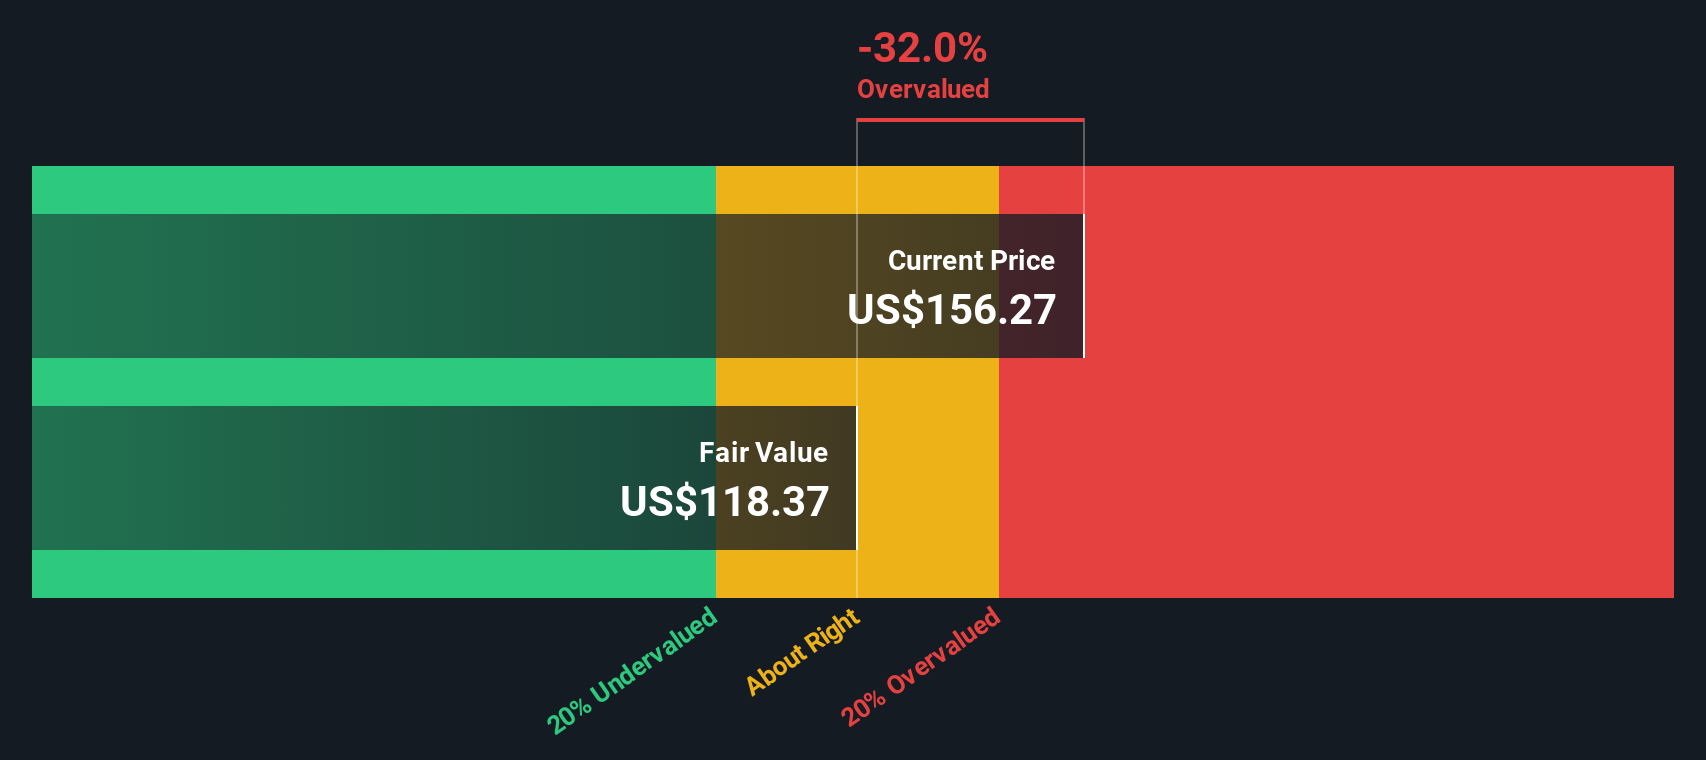
Our Excess Returns analysis suggests Morgan Stanley may be overvalued by 18.5%. Find undervalued stocks or create your own screener to find better value opportunities.
Approach 2: Morgan Stanley Price vs Earnings
For companies like Morgan Stanley that regularly post strong profits, the price-to-earnings (PE) ratio is a tried-and-true way to gauge valuation. This metric helps investors see how much they are paying for each dollar of a company’s annual earnings, making it especially useful when those earnings are robust and consistent. In general, higher growth expectations and lower risk can justify a higher “normal” or “fair” PE ratio, while riskier or slower-growing companies typically deserve a lower one.
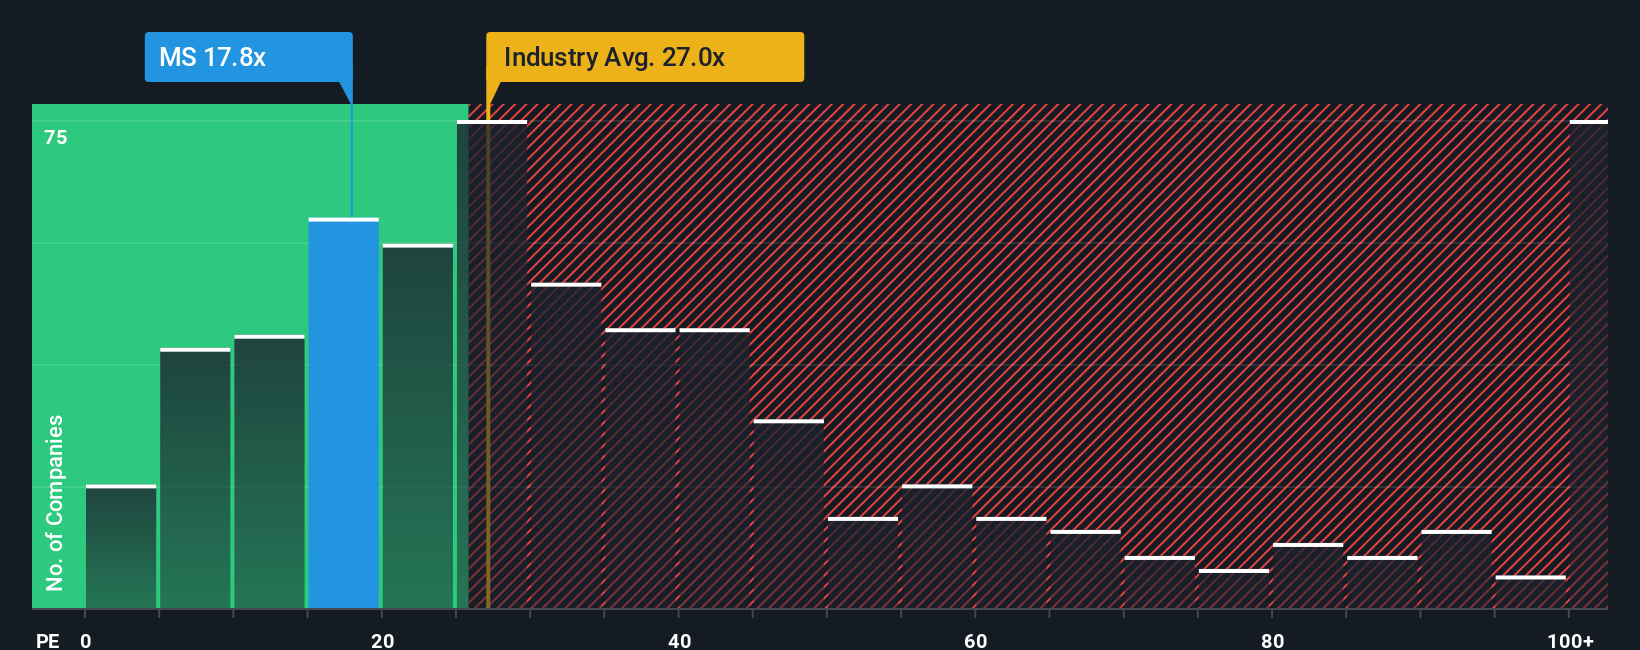
Right now, Morgan Stanley is trading at a PE of 16.16x. That is noticeably below both the Capital Markets industry average of 26.01x and the peer average of 32.91x. This signals that investors currently pay less for Morgan Stanley’s earnings compared to similar companies. However, raw comparisons only tell part of the picture.
Simply Wall St’s “Fair Ratio” is a proprietary estimate that pulls together not just industry position and profit margin, but also future growth, company size, and specific risks. This offers a more tailored benchmark than simply matching up against other firms. For Morgan Stanley, the Fair Ratio comes in at 20.60x, reflecting a blend of the company’s above-average growth prospects but also its risk environment. Compared with the actual PE, this suggests Morgan Stanley’s market price is a touch below its tailored fair value, hinting at potential opportunity but not deep undervaluation.
Result: UNDERVALUED
PE ratios tell one story, but what if the real opportunity lies elsewhere? Discover companies where insiders are betting big on explosive growth.
Upgrade Your Decision Making: Choose your Morgan Stanley Narrative
Earlier, we mentioned there is an even better way to understand valuation, so let’s introduce you to Narratives. In simple terms, a Narrative is your investment story. It is how you connect your outlook on Morgan Stanley’s business, like assumptions about future earnings or risk, to a concrete financial forecast and ultimately a fair value.
Unlike looking at numbers in isolation, Narratives let you lay out your perspective behind the numbers by integrating factors such as your views on wealth trends, margins, or market share with your own future estimates. This approach bridges the company’s story to its numbers and directly links your expectations with an actionable fair value.
Narratives are simple, dynamic, and accessible for everyone thanks to Simply Wall St’s platform, where millions of investors share and follow Narratives on the Community page. They continuously update as new events, earnings, or news emerge, meaning your story adjusts in real time. This empowers you to decide if the most recent Fair Value, shaped by your evolving view, justifies buying, holding, selling, or doing nothing at all.
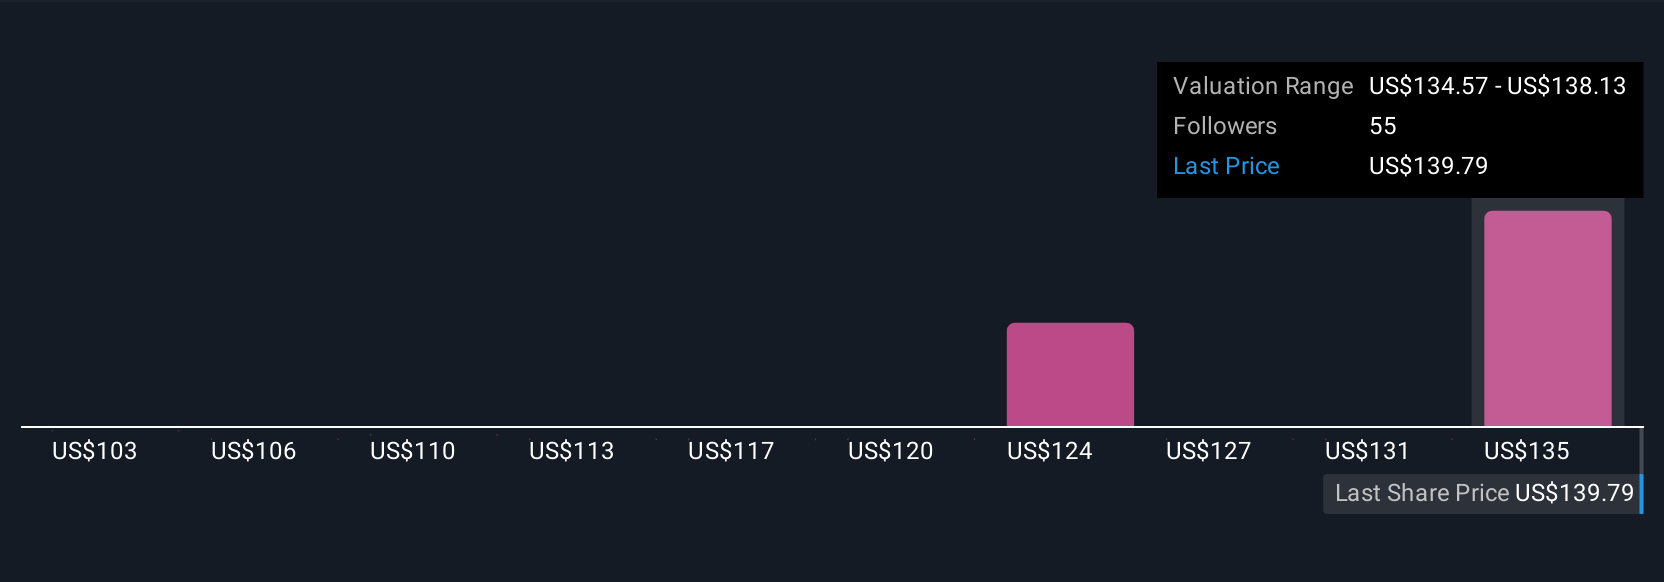
For Morgan Stanley, one investor’s Narrative might point to a fair value of $122 if they are cautious about digital disruption and margin pressures. Another investor, who is more optimistic about global wealth and tech investment, could justify $160. It all depends on the story you believe and the numbers you expect.
Do you think there's more to the story for Morgan Stanley? Create your own Narrative to let the Community know!
This article by Simply Wall St is general in nature. We provide commentary based on historical data and analyst forecasts only using an unbiased methodology and our articles are not intended to be financial advice. It does not constitute a recommendation to buy or sell any stock, and does not take account of your objectives, or your financial situation. We aim to bring you long-term focused analysis driven by fundamental data. Note that our analysis may not factor in the latest price-sensitive company announcements or qualitative material. Simply Wall St has no position in any stocks mentioned.
New: Manage All Your Stock Portfolios in One Place
We've created the ultimate portfolio companion for stock investors, and it's free.
• Connect an unlimited number of Portfolios and see your total in one currency
• Be alerted to new Warning Signs or Risks via email or mobile
• Track the Fair Value of your stocks
Have feedback on this article? Concerned about the content? Get in touch with us directly. Alternatively, email editorial-team@simplywallst.com
About NYSE:MS
Morgan Stanley
A financial holding company, provides various financial products and services to governments, financial institutions, and individuals in the Americas, Asia, Europe, Middle East, and Africa.
Solid track record average dividend payer.
Similar Companies
Market Insights

Advertisement
Community Narratives
Finding The True Value Of A Logistics Powerhouse
Fair Value US$95.21|8.5% undervalued
NV
Community Contributor
Paradigm Biopharmaceuticals Will Lead Osteoarthritis Treatment with Zilosul's FDA Success
Fair Value AU$5.50|91.8% undervalued
AM
Community Contributor
Barrick Mining (ABX:CA): A Gold Hedge against a U.S. Shutdown
Fair Value CA$60.00|26.5% undervalued
GM
Community Contributor