Advertisement
- United States
- /
- Capital Markets
- /
- NYSE:GS
Should Investors Reassess Goldman Sachs After Its 45% Rally and Recent Price Pullback in 2025?

Simply Wall St
Reviewed by Bailey Pemberton
If you have ever wondered what to do with Goldman Sachs Group stock right now, you are not alone. Whether you are already invested or just keeping an eye on the market’s major financial players, the company’s price movements have given investors much to consider. Over the past year, the stock shot up a striking 45.0%, with an even larger 312.5% gain over the past five years. However, the last month has brought a small pullback of 5.5%, and the last week saw a 1.8% dip. These shorter-term moves come as markets adjust to shifting risk perceptions in the financial sector and respond to evolving macroeconomic conditions that have some investors taking profits.
Despite the ups and downs, Goldman Sachs Group’s year-to-date return stands at an impressive 30.6%, cementing its reputation as a force in global finance. But growth is only part of the picture. Investors keen on understanding whether now is the right time to act have to grapple with the question of valuation. Is the stock too expensive, or does it offer value relative to its fundamentals? On a standard scale that adds one point for each of six undervalued checks, Goldman Sachs clocks in with a valuation score of 3, which means it looks undervalued on half of those measures.
Of course, there is more than one way to value a stock, so it is useful to break down the standard valuation approaches to see what is really driving that score and to consider a smarter way to frame the whole question. This can help provide perspective no matter what the market is doing next.
Approach 1: Goldman Sachs Group Excess Returns Analysis
The Excess Returns model estimates a company’s intrinsic value by focusing on how much return its investments produce over and above the cost of equity. It highlights both the returns on invested capital and the efficiency of that capital in generating sustained profitability over time, which is especially relevant for financial institutions like Goldman Sachs Group.
For Goldman Sachs Group, the key valuation figures are:
- Book Value: $343.75 per share
- Stable Earnings Per Share (EPS): $59.37 per share
(Source: Weighted future Return on Equity estimates from 12 analysts.) - Cost of Equity: $37.55 per share
- Excess Return: $21.82 per share
- Average Return on Equity: 15.42%
- Stable Book Value: $385.12 per share
(Source: Weighted future Book Value estimates from 14 analysts.)
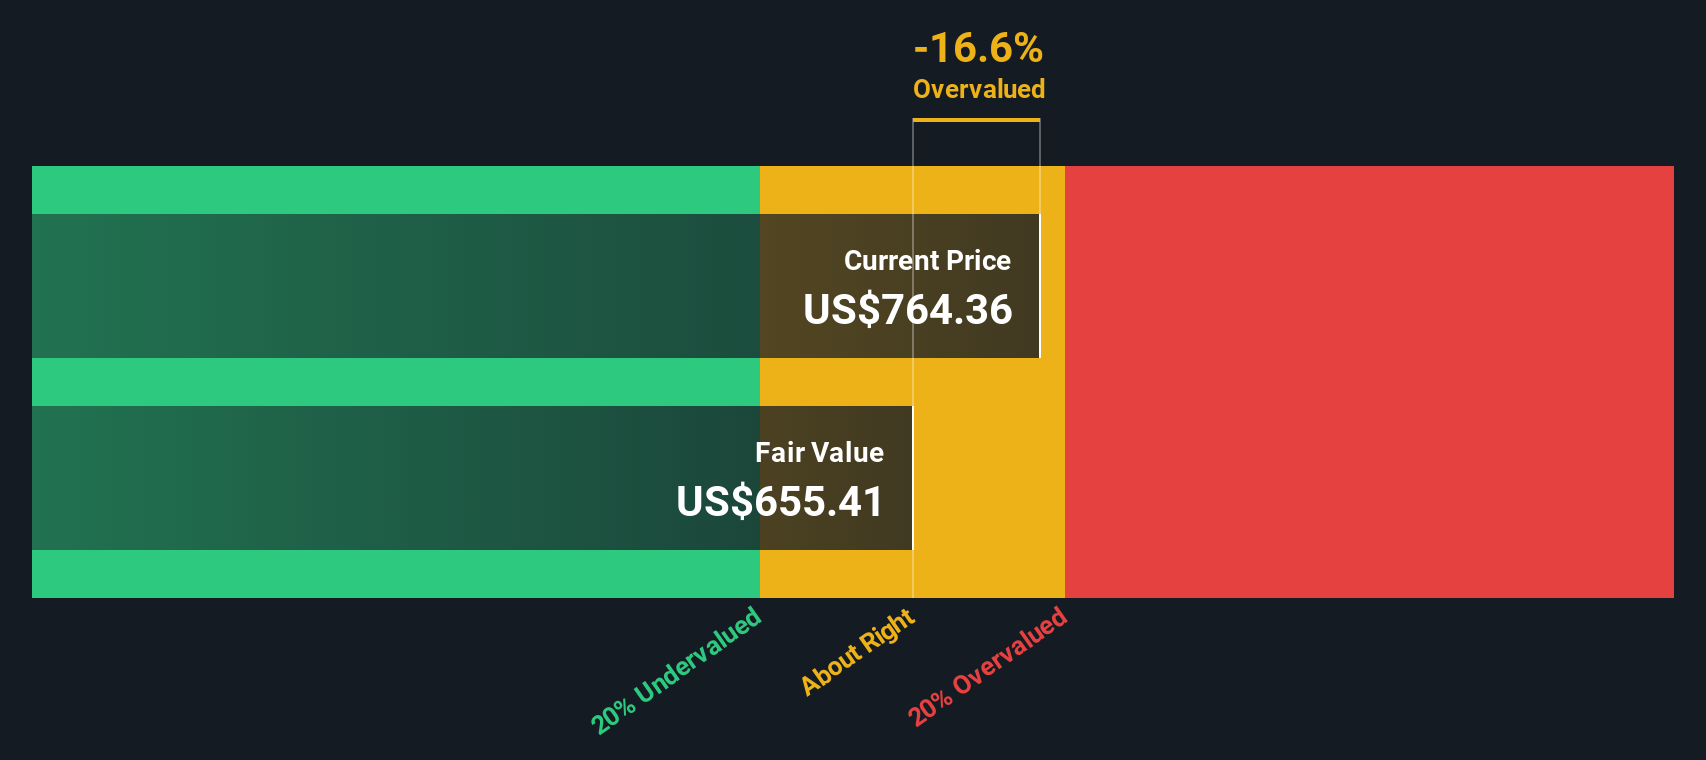
Based on this approach, the company’s intrinsic value is estimated to be slightly below the current share price. The model implies Goldman Sachs Group is 5.4% overvalued at present. This puts the current price within a close range of fair value and indicates only a modest deviation from the estimated intrinsic value.
Result: ABOUT RIGHT
Simply Wall St performs a valuation analysis on every stock in the world every day (check out Goldman Sachs Group's valuation analysis). We show the entire calculation in full. You can track the result in your watchlist or portfolio and be alerted when this changes.
Approach 2: Goldman Sachs Group Price vs Earnings
The Price-to-Earnings (PE) ratio is widely regarded as a useful valuation metric for profitable companies like Goldman Sachs Group because it directly compares a company’s share price to its per-share earnings. This makes it easier for investors to gauge how much they are paying for each dollar of current earnings, offering a straightforward perspective on value.
It is important to remember that what counts as a “normal” or “fair” PE ratio can change depending on the market’s expectations for growth and the perceived risk of the company. Companies with higher expected future earnings growth or lower risk profiles typically command higher PE multiples. In contrast, slower-growing or riskier companies often trade at lower ratios.
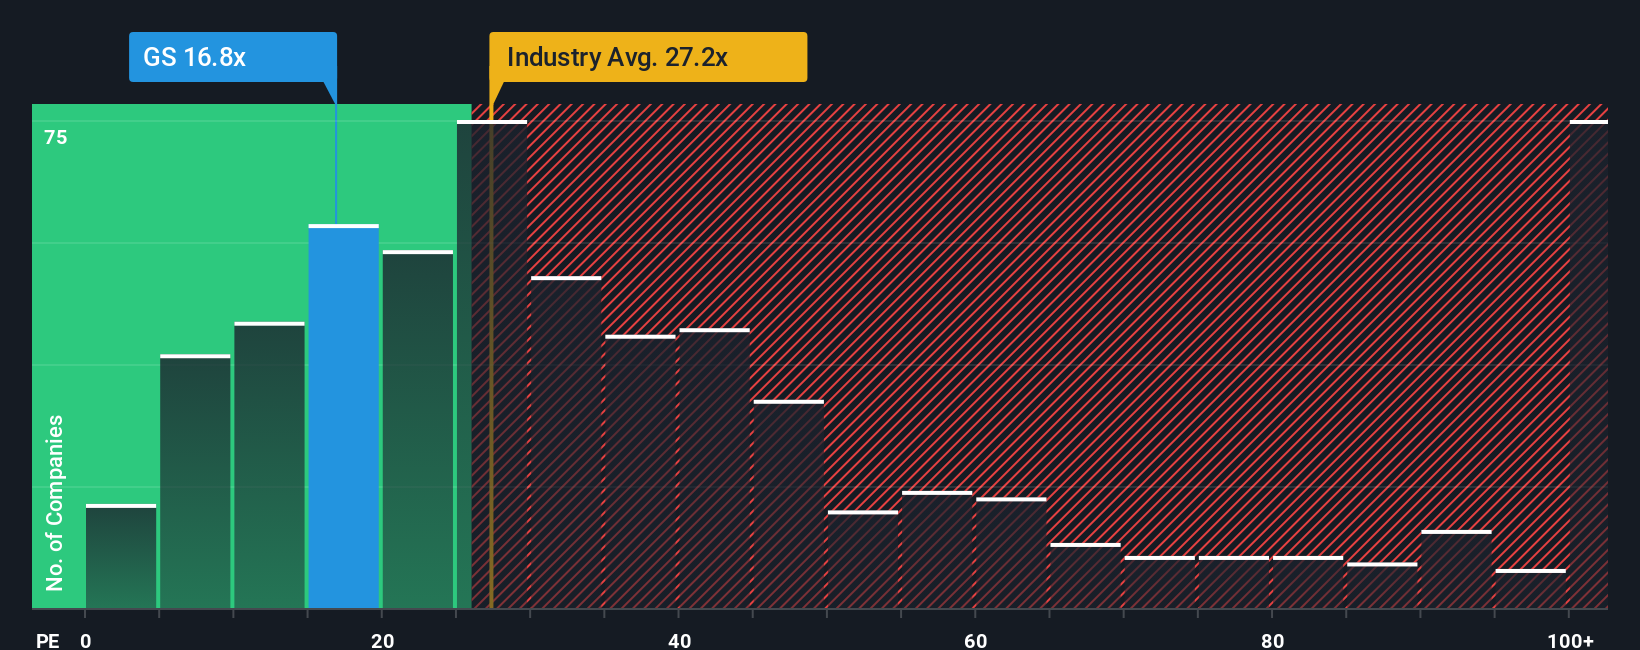
Goldman Sachs Group’s current PE ratio sits at 15x, which is notably lower than the Capital Markets industry average of 25.13x and the peer group average of 33.74x. At first glance, this could suggest the stock is undervalued compared to its sector. However, the Fair Ratio from Simply Wall St provides a more precise benchmark for Goldman Sachs Group by considering not just the industry landscape but also the company’s unique earnings growth, risk factors, profit margins, and market cap. For Goldman Sachs Group, the Fair Ratio is 20.86x.
Unlike industry averages, the Fair Ratio is tailored to the company’s underlying strengths and risks. This makes it a more reliable measure of intrinsic value. In this case, with the actual PE ratio of 15x moderately below the Fair Ratio of 20.86x, the evidence points to the stock being undervalued on this basis.
Result: UNDERVALUED
PE ratios tell one story, but what if the real opportunity lies elsewhere? Discover companies where insiders are betting big on explosive growth.
Upgrade Your Decision Making: Choose your Goldman Sachs Group Narrative
Earlier we mentioned that there is an even better way to understand valuation, so let's introduce you to Narratives. A Narrative is simply your story or perspective about a company, combining your unique outlook on Goldman Sachs Group’s future with your own assumptions for fair value, revenue, earnings, and profit margins. Narratives connect the “why” behind a company’s numbers with a specific financial forecast and resulting fair value, making the investing process more personal and reasoned.
With Narratives on Simply Wall St’s Community page, millions of investors are empowered to explore or create different perspectives on Goldman Sachs Group and easily compare their fair value to the current market price for more informed buy or sell decisions. These Narratives update automatically whenever new information, such as earnings or news, emerges, helping your insights stay relevant and timely.
For example, one investor tracking bullish merger activity and digital transformation might project robust revenue and assign a high fair value of $815 per share. Another investor, wary of regulatory risk and global market uncertainty, could use more cautious estimates for a lower value of $538. With Narratives, your view can directly shape your strategy. Just choose, refine, and revisit as the story changes.
Do you think there's more to the story for Goldman Sachs Group? Create your own Narrative to let the Community know!
This article by Simply Wall St is general in nature. We provide commentary based on historical data and analyst forecasts only using an unbiased methodology and our articles are not intended to be financial advice. It does not constitute a recommendation to buy or sell any stock, and does not take account of your objectives, or your financial situation. We aim to bring you long-term focused analysis driven by fundamental data. Note that our analysis may not factor in the latest price-sensitive company announcements or qualitative material. Simply Wall St has no position in any stocks mentioned.
New: Manage All Your Stock Portfolios in One Place
We've created the ultimate portfolio companion for stock investors, and it's free.
• Connect an unlimited number of Portfolios and see your total in one currency
• Be alerted to new Warning Signs or Risks via email or mobile
• Track the Fair Value of your stocks
Have feedback on this article? Concerned about the content? Get in touch with us directly. Alternatively, email editorial-team@simplywallst.com
About NYSE:GS
Goldman Sachs Group
A financial institution, provides a range of financial services for corporations, financial institutions, governments, and individuals in the Americas, Europe, the Middle East, Africa, and Asia.
Proven track record average dividend payer.
Similar Companies
Market Insights

Advertisement
Community Narratives
Kodiak AI - a potential 100 bagger opportunity?
Fair Value US$14.00|41.9% undervalued
DA
Community Contributor
A Fair Price for a Great Business Facing Real Threats
Fair Value US$383.06|13.0% undervalued
IM
Community Contributor
AXON And Shopify Integration Will Unlock Global Mobile Advertising
Fair Value US$613.59|2.3% undervalued
AN
Based on Analyst Price Targets