Advertisement
- United States
- /
- Capital Markets
- /
- NasdaqGS:TW
Evaluating Tradeweb After Q1 Earnings Miss and Slowing Revenue Growth

Simply Wall St
Reviewed by Bailey Pemberton
Considering what to do next with Tradeweb Markets? You are definitely not alone. With the stock recently closing at $107.92, and its one-week return almost flat at 0.1%, you might be wondering whether it is poised for another breakout or stuck in a rut. The past month has seen a dip of -7.6%, and looking back year-to-date, shares are down -17.8%. Even the one-year return clocks in at -19.0%. However, if we zoom out further, there is a very different story. Over the past three years, Tradeweb has soared 104.7%, and over five years, it is up a remarkable 84.8%. This kind of dramatic long-term growth keeps Tradeweb firmly on investors' radar, especially as market dynamics keep shifting and electronic trading platforms such as Tradeweb continue to play a bigger role.
Despite those strong multi-year gains, Tradeweb’s valuation is the focus now, particularly as its value score currently sits at 0. That means it does not pass any of the six standard undervaluation checks, which raises an eyebrow for investors looking for a bargain. So, is the market pricing in continued strength, or is something else going on under the hood?
Let us dig into the major valuation approaches you might use to decide whether Tradeweb Markets deserves a place in your portfolio. And before you finish reading, I will share an even more insightful perspective on valuation that goes beyond the usual checklists.
Tradeweb Markets scores just 0/6 on our valuation checks. See what other red flags we found in the full valuation breakdown.
Approach 1: Tradeweb Markets Excess Returns Analysis
The Excess Returns model helps investors assess whether a company is generating returns above its cost of equity, signaling efficient use of capital. For Tradeweb Markets, this approach centers on key metrics like return on equity and growth in book value.
Analyzing recent estimates, Tradeweb's book value per share stands at $28.58, while its projected stable earnings per share (EPS) reach $4.10. These numbers are supported by a weighted average return on equity of 13.04 percent, as forecasted by five different analysts. The company’s cost of equity is $2.53 per share, meaning investors expect at least this much annual return given the stock’s risk profile. Consequently, Tradeweb is estimated to generate $1.57 in excess return per share, or the portion of profit exceeding its capital costs. Future projections see the stable book value growing to $31.46 per share, also from a consensus of analyst estimates.
How does this translate to valuation? The model estimates an intrinsic value of $63.04 per share for Tradeweb. With the current stock price at $107.92, this implies the shares are trading 71.2 percent above their intrinsic value. In other words, investors are likely paying a substantial premium well beyond what the company’s excess returns justify at this stage.
Result: OVERVALUED
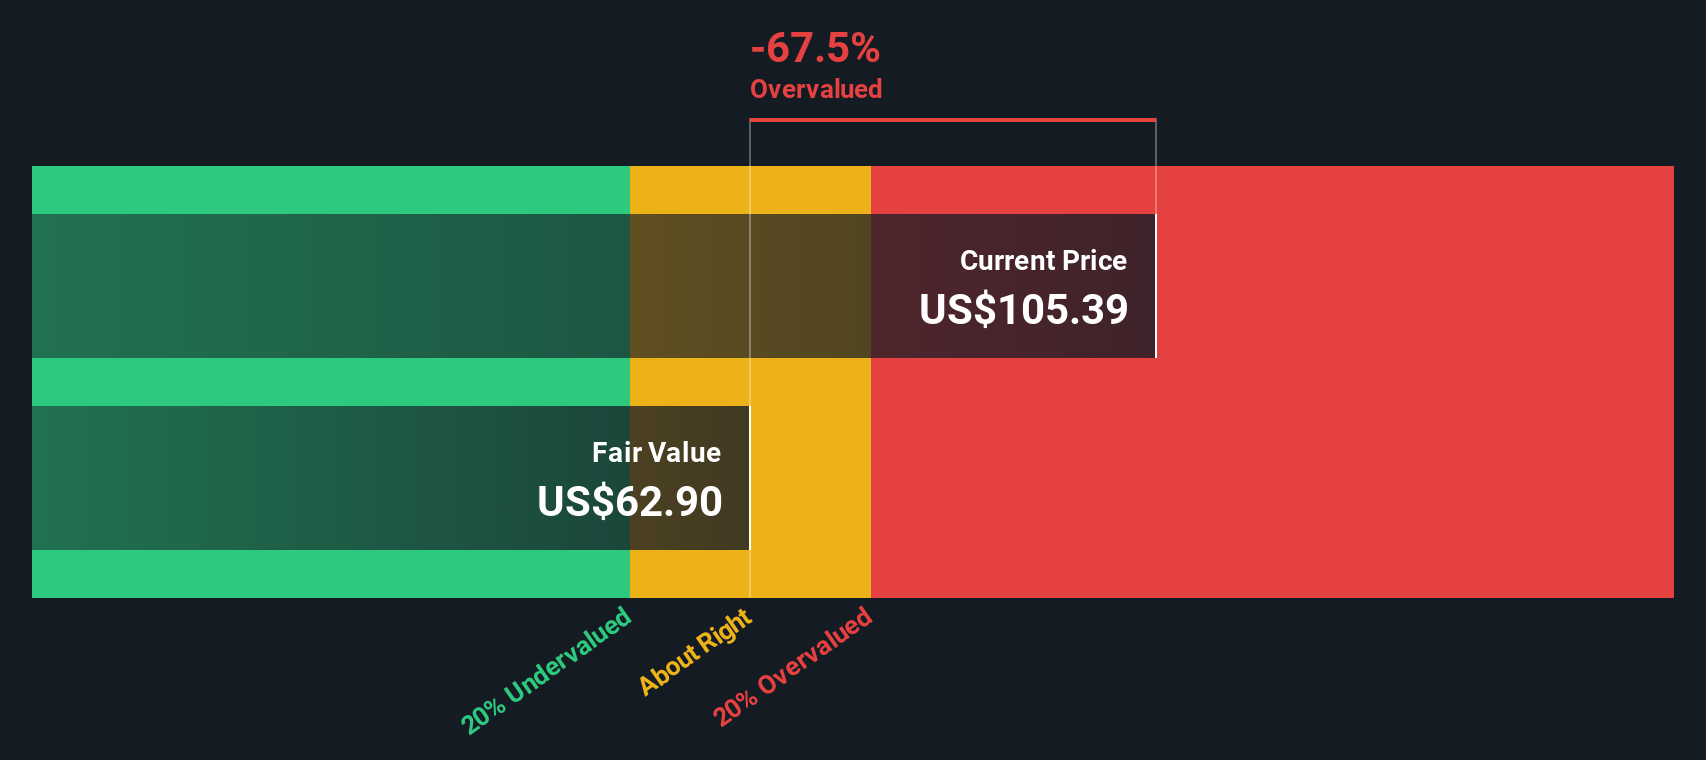
Our Excess Returns analysis suggests Tradeweb Markets may be overvalued by 71.2%. Find undervalued stocks or create your own screener to find better value opportunities.
Approach 2: Tradeweb Markets Price vs Earnings
For profitable companies such as Tradeweb Markets, the Price-to-Earnings (PE) multiple is a widely accepted valuation metric. It is favored because it directly compares the company’s current share price to its per-share earnings, providing an easily interpretable measure of how the market values a company’s ability to generate profits.
What is considered a "fair" PE ratio depends on factors like expected earnings growth and risk. Generally, companies with stronger growth prospects or lower risks command higher PE ratios, while those with more average or uncertain outlooks trade at lower multiples.
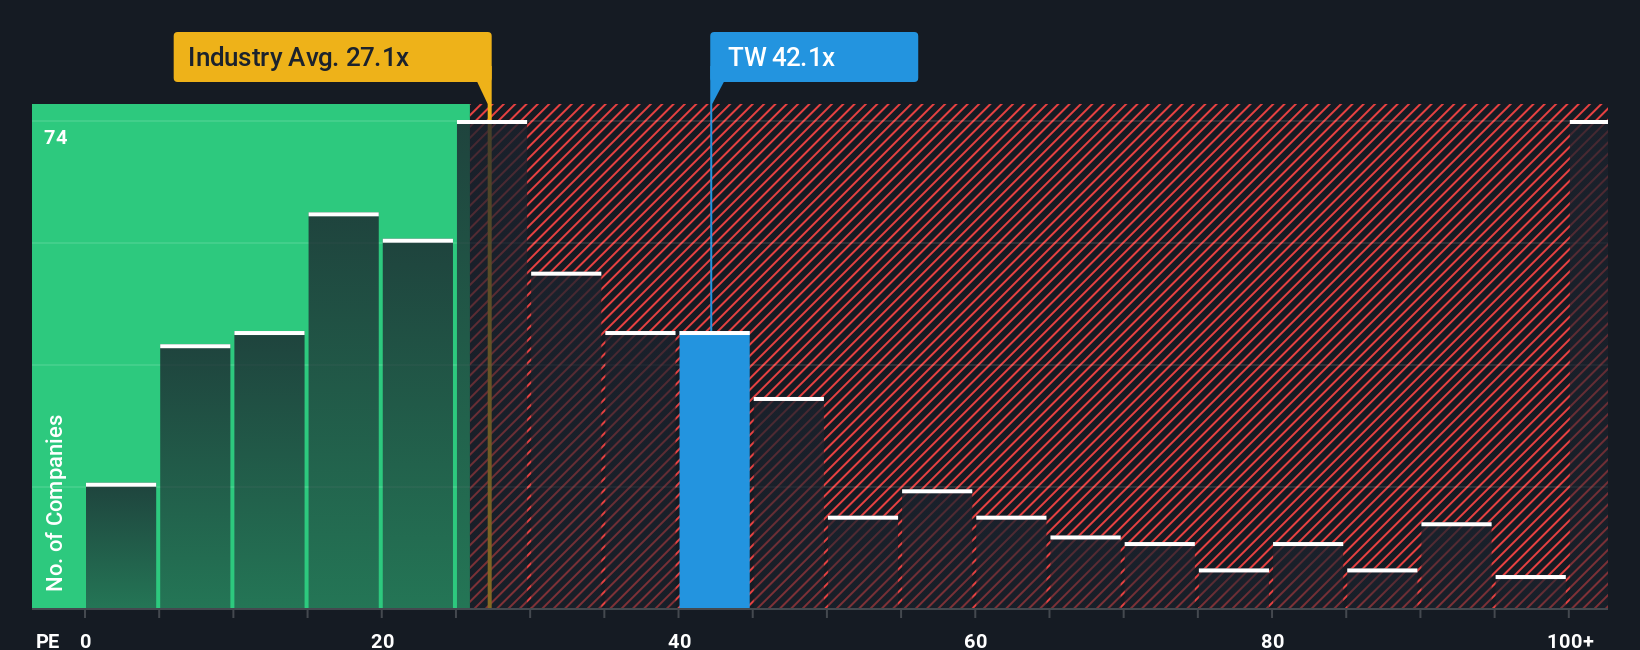
Tradeweb Markets currently has a PE ratio of 41.3x, which stands well above both its capital markets industry average of 25.7x and the peer group average of 29.1x. While this might initially make the stock look expensive, it is important to dig deeper. That is where Simply Wall St's proprietary “Fair Ratio” comes in. This figure is calculated to reflect a company’s earnings growth, industry characteristics, profit margins, market cap, and associated risks. For Tradeweb, the Fair Ratio stands at 18.4x, notably lower than both its current multiple and its peer benchmarks.
Comparing to the Fair Ratio matters because it adjusts for business quality and growth, offering a more robust view than simply benchmarking against peers or the industry. In this case, Tradeweb’s PE sits significantly above its Fair Ratio, suggesting the market premium is not fully supported by its fundamentals.
Result: OVERVALUED
PE ratios tell one story, but what if the real opportunity lies elsewhere? Discover companies where insiders are betting big on explosive growth.
Upgrade Your Decision Making: Choose your Tradeweb Markets Narrative
Earlier, we mentioned there's an even better way to understand valuation, so let us introduce you to Narratives—a smart, user-friendly approach that connects a company’s story and outlook to its numbers, helping you make investment decisions with greater clarity and confidence.
A Narrative simply means your own view on where a company is heading and why, supported by your expectations for future revenue, earnings, and profit margins. These elements come together to produce an estimated fair value. Narratives bridge the gap between the numbers on the page and the real-world story behind them, translating complex forecasts into an investment case that makes sense to you.
This approach is available right now on Simply Wall St’s Community page, used by millions of investors, where anyone can compare different Narratives and see how each leads to a particular fair value. With Narratives, you can easily track whether Tradeweb’s current price offers an opportunity or suggests caution by comparing it to your own or others' fair value estimates, and insights update automatically as new news or earnings are released.
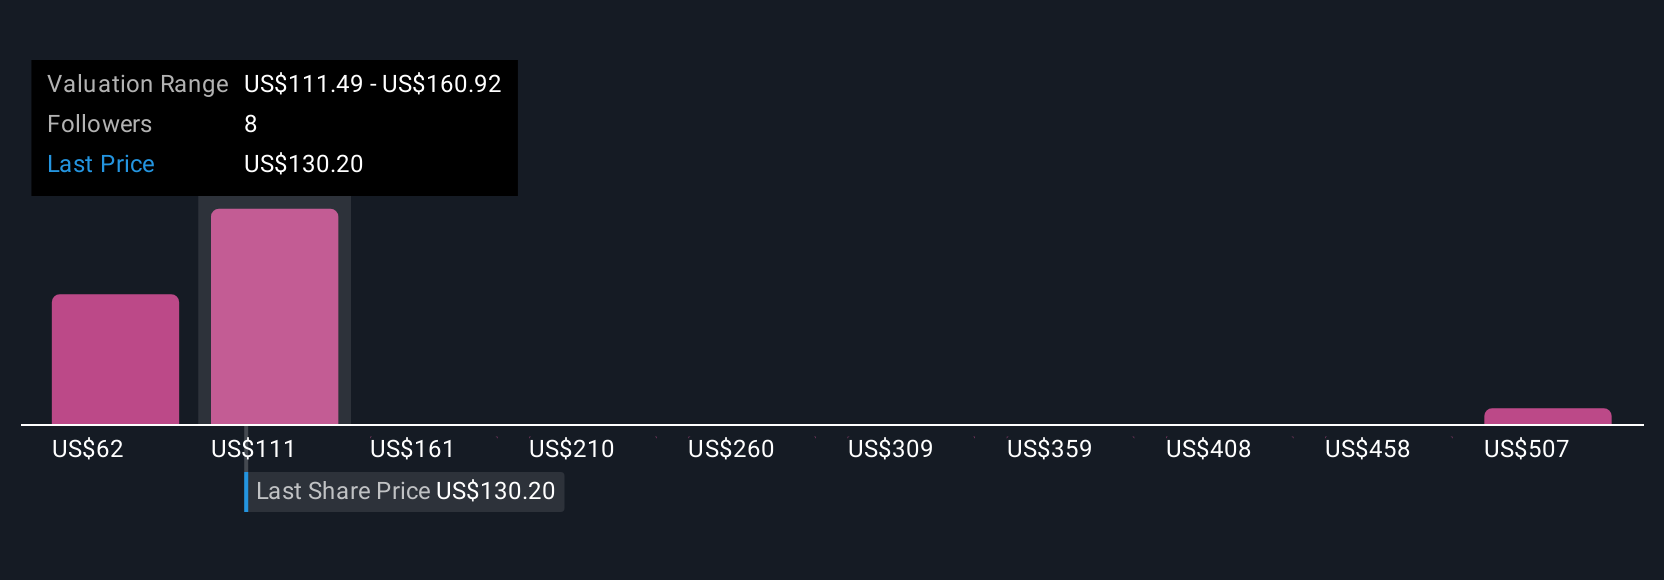
For example, the most optimistic investors currently see Tradeweb Markets fairly valued at $210.0 per share, while the most cautious put that number closer to $118.0. Your Narrative can reflect your unique outlook and guide your own buy or sell decisions.
Do you think there's more to the story for Tradeweb Markets? Create your own Narrative to let the Community know!
This article by Simply Wall St is general in nature. We provide commentary based on historical data and analyst forecasts only using an unbiased methodology and our articles are not intended to be financial advice. It does not constitute a recommendation to buy or sell any stock, and does not take account of your objectives, or your financial situation. We aim to bring you long-term focused analysis driven by fundamental data. Note that our analysis may not factor in the latest price-sensitive company announcements or qualitative material. Simply Wall St has no position in any stocks mentioned.
Valuation is complex, but we're here to simplify it.
Discover if Tradeweb Markets might be undervalued or overvalued with our detailed analysis, featuring fair value estimates, potential risks, dividends, insider trades, and its financial condition.
Access Free AnalysisHave feedback on this article? Concerned about the content? Get in touch with us directly. Alternatively, email editorial-team@simplywallst.com
About NasdaqGS:TW
Tradeweb Markets
Tradeweb Markets Inc., together with its subsidiaries, builds and operates electronic marketplaces worldwide.
Solid track record with adequate balance sheet.
Similar Companies
Market Insights

Advertisement
Community Narratives
A formidable player in AI and enterprise computing.
Fair Value US$210.00|13.6% overvalued
CO
Community Contributor
IREN's Bold Moves in Sustainable Bitcoin Mining & AI Data Centers
Fair Value US$89.00|23.6% undervalued
BL
Community Contributor
Cooling the Champions: The Aussie Tech Behind F1's Victories
Fair Value AU$12.40|37.6% undervalued
TR
Community Contributor