Advertisement
- United States
- /
- Diversified Financial
- /
- NasdaqCM:MBIN
A Fresh Look at Merchants Bancorp (MBIN) Valuation as Investors Weigh Cost and Margin Concerns

Simply Wall St
Reviewed by Kshitija Bhandaru
Recent commentary has put Merchants Bancorp (MBIN) in the spotlight, as investors react to concerns over the bank’s net interest margin, higher servicing and capital costs, and operating expenses that now take up a larger slice of revenue.
See our latest analysis for Merchants Bancorp.
Although Merchants Bancorp's $31.75 share price has faced pressure due to recent concerns over costs and margins, the bigger picture reveals a notable shift in momentum. While the one-year total shareholder return sits at -28.8%, the stock's long-term results are far more robust. A 131% total return over five years highlights its underlying growth story despite recent setbacks.
If you're reevaluating your portfolio in light of changing momentum, now could be the perfect time to discover fast growing stocks with high insider ownership
Yet with a considerable discount to analyst price targets and solid long-term gains, is the current weakness in Merchants Bancorp’s stock a window of opportunity for value investors, or is the market already factoring in future growth?
Price-to-Earnings of 7x: Is it justified?
With Merchants Bancorp trading at a price-to-earnings multiple of just 7x, the market is pricing the stock well below its peer group and industry averages. The last close of $31.75 hints at significant undervaluation when compared to the ratios found across the US Diversified Financial sector.
The price-to-earnings (P/E) multiple measures how investors value a stock relative to its earnings. Lower numbers can mean the company is trading at a discount or that expectations for future growth are muted. For financials like Merchants Bancorp, the P/E ratio often reflects not only current profitability but also how stable or predictable those earnings are forecast to be.
In Merchants Bancorp's case, the 7x P/E looks notably low versus the US industry average of 15.7x and an estimated fair P/E ratio of 15.1x. This stark discount suggests the market may be underestimating MBIN’s underlying earnings quality and growth trajectory, potentially leaving room for a re-rating if fundamentals remain robust.
Explore the SWS fair ratio for Merchants Bancorp
Result: Price-to-Earnings of 7x (UNDERVALUED)
However, rising operating expenses and ongoing margin pressure could challenge Merchants Bancorp's recovery. These factors may potentially limit upside if cost trends persist.
Find out about the key risks to this Merchants Bancorp narrative.
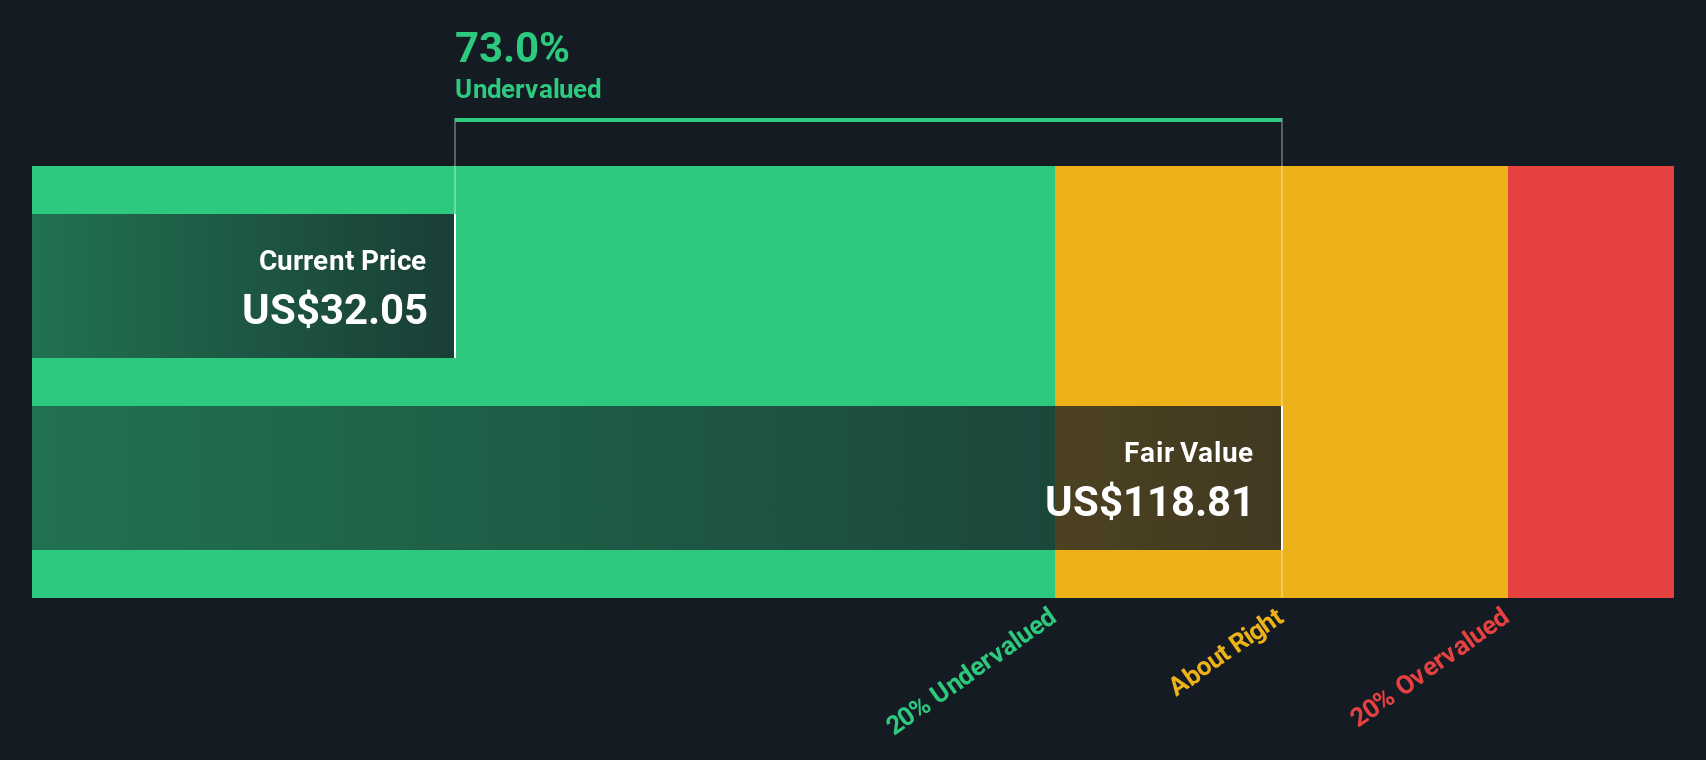
Another View: SWS DCF Model Tells a Different Story
While value-focused investors may find Merchants Bancorp's low 7x price-to-earnings ratio compelling, our SWS DCF model paints an even more striking picture. The DCF approach suggests the stock is trading a remarkable 74% below its estimated fair value. This is a much larger gap than what the multiples indicate, raising questions about whether the market is overlooking a bargain or signaling deeper uncertainties. Can both views be right, or is one missing the full story?
Look into how the SWS DCF model arrives at its fair value.
Simply Wall St performs a discounted cash flow (DCF) on every stock in the world every day (check out Merchants Bancorp for example). We show the entire calculation in full. You can track the result in your watchlist or portfolio and be alerted when this changes, or use our stock screener to discover undervalued stocks based on their cash flows. If you save a screener we even alert you when new companies match - so you never miss a potential opportunity.
Build Your Own Merchants Bancorp Narrative
If you would rather draw your own conclusions from the numbers or see things differently, you can quickly craft a custom narrative that fits your view. Do it your way
A great starting point for your Merchants Bancorp research is our analysis highlighting 4 key rewards and 2 important warning signs that could impact your investment decision.
Looking for more investment ideas?
Don't limit your portfolio to just one opportunity. Let Simply Wall Street's powerful tools point you to stellar stocks that others may be missing right now.
- Spot the strongest yields and steady potential by checking out these 18 dividend stocks with yields > 3%, which consistently deliver above-average income.
- Gain an edge on artificial intelligence's next big winners through these 25 AI penny stocks, surfacing innovative players in this rapidly advancing field.
- Secure undervalued gems before the crowd by scanning these 891 undervalued stocks based on cash flows, packed with companies trading below their cash flow potential.
This article by Simply Wall St is general in nature. We provide commentary based on historical data and analyst forecasts only using an unbiased methodology and our articles are not intended to be financial advice. It does not constitute a recommendation to buy or sell any stock, and does not take account of your objectives, or your financial situation. We aim to bring you long-term focused analysis driven by fundamental data. Note that our analysis may not factor in the latest price-sensitive company announcements or qualitative material. Simply Wall St has no position in any stocks mentioned.
New: Manage All Your Stock Portfolios in One Place
We've created the ultimate portfolio companion for stock investors, and it's free.
• Connect an unlimited number of Portfolios and see your total in one currency
• Be alerted to new Warning Signs or Risks via email or mobile
• Track the Fair Value of your stocks
Have feedback on this article? Concerned about the content? Get in touch with us directly. Alternatively, email editorial-team@simplywallst.com
About NasdaqCM:MBIN
Merchants Bancorp
Operates as the diversified bank holding company in the United States.
Very undervalued with adequate balance sheet.
Market Insights

Advertisement
Community Narratives
A formidable player in AI and enterprise computing.
Fair Value US$210.00|3.1% overvalued
CO
Community Contributor
IREN's Bold Moves in Sustainable Bitcoin Mining & AI Data Centers
Fair Value US$72.52|11.6% undervalued
BL
Community Contributor
Cooling the Champions: The Aussie Tech Behind F1's Victories
Fair Value AU$12.40|39.4% undervalued
TR
Community Contributor