Advertisement
- United States
- /
- Capital Markets
- /
- NasdaqCM:FRHC
Is Freedom Holding’s Rally Justified After Recent Stock Slide and SEC Review?

Simply Wall St
Reviewed by Bailey Pemberton
If you are trying to decide what to do with Freedom Holding’s stock, you are not alone. After a dizzying five-year rally that has seen shares soar by 538.2%, it is only natural to wonder if the impressive climb can continue. Even in the past year alone, Freedom Holding posted a 74.4% gain, and the stock is up 26.2% since the start of the year. Yet, the last month tells a more cautious story, with the price sliding by 0.8%. Over the past week, it dipped by 2.8%, reminding investors that even high-flyers face turbulence.
What adds to the intrigue is how these moves seem to defy typical risk perceptions in the broader market. Despite ongoing market shifts and economic headlines, Freedom Holding’s momentum has remained surprisingly resilient. Some investors may now be pausing to reassess the company’s future trajectory.
There is another twist to consider. If you are looking at traditional valuation metrics, you might expect such a high-performing stock to show signs of undervaluation somewhere. Yet, using a multi-check valuation system, where each of six checks adds one to the undervaluation score, Freedom Holding scores 0 out of 6. This means it is not undervalued according to any of these measures.
So, where does that leave us? In the following sections, we will walk through the main valuation approaches analysts use, sift through the numbers, and later, explore a smarter angle that could give you an even clearer view on the true worth of this stock.
Freedom Holding scores just 0/6 on our valuation checks. See what other red flags we found in the full valuation breakdown.
Approach 1: Freedom Holding Excess Returns Analysis
The Excess Returns model measures how much value a company generates above its cost of equity. This model focuses on return on invested capital and sustainable growth rather than just simple earnings multiples.
For Freedom Holding, the key inputs are as follows:
- Book Value: $20.08 per share
- Stable EPS: $4.75 per share
(Source: Median Return on Equity from the past 5 years.) - Cost of Equity: $1.48 per share
- Excess Return: $3.27 per share
- Average Return on Equity: 27.35%
- Stable Book Value: $17.37 per share
(Source: Median Book Value from the past 5 years.)
This approach estimates the intrinsic value of Freedom Holding’s stock at $77.13 per share. Compared to its current market price, this implies the stock is 118.0% overvalued by this method, meaning investors are currently paying well above what this return-focused model suggests is reasonable.
Result: OVERVALUED
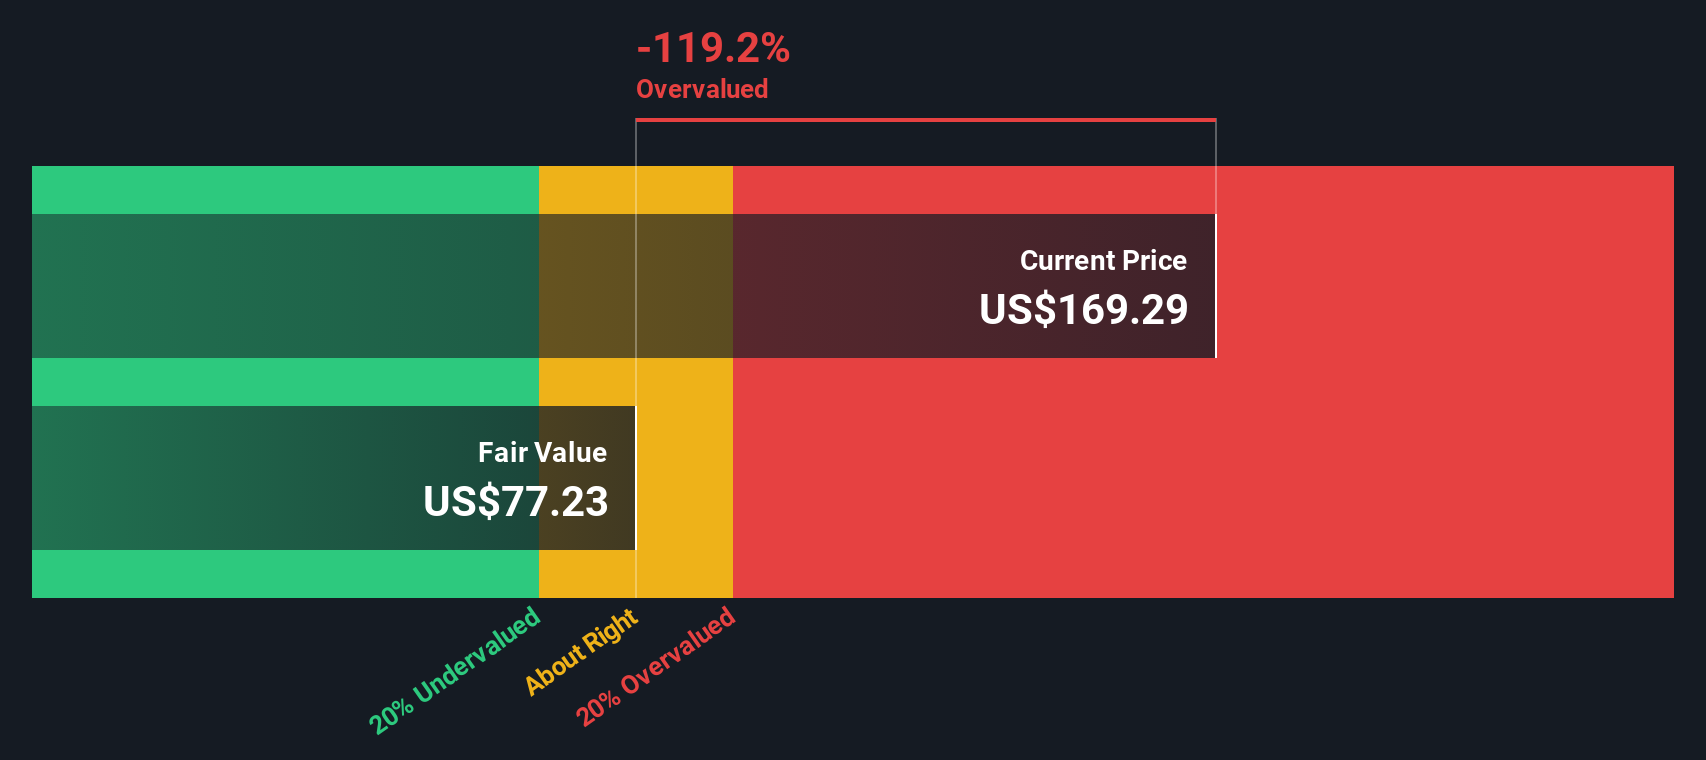
Our Excess Returns analysis suggests Freedom Holding may be overvalued by 118.0%. Find undervalued stocks or create your own screener to find better value opportunities.
Approach 2: Freedom Holding Price vs Earnings
For established, profitable companies like Freedom Holding, the price-to-earnings (PE) ratio is widely used because it reflects how much investors are willing to pay for a dollar of earnings. This metric is especially useful since it connects directly to the company’s bottom line, helping investors quickly gauge valuation in a familiar context.
What counts as a “fair” PE ratio is typically shaped by the company's expected growth and risk profile. Fast-growing businesses or those with more predictable earnings can command higher PE ratios. More mature or riskier firms usually trade at lower ones. Comparing to sector averages and similar companies gives us a starting point, but it requires deeper context for reliable insight.
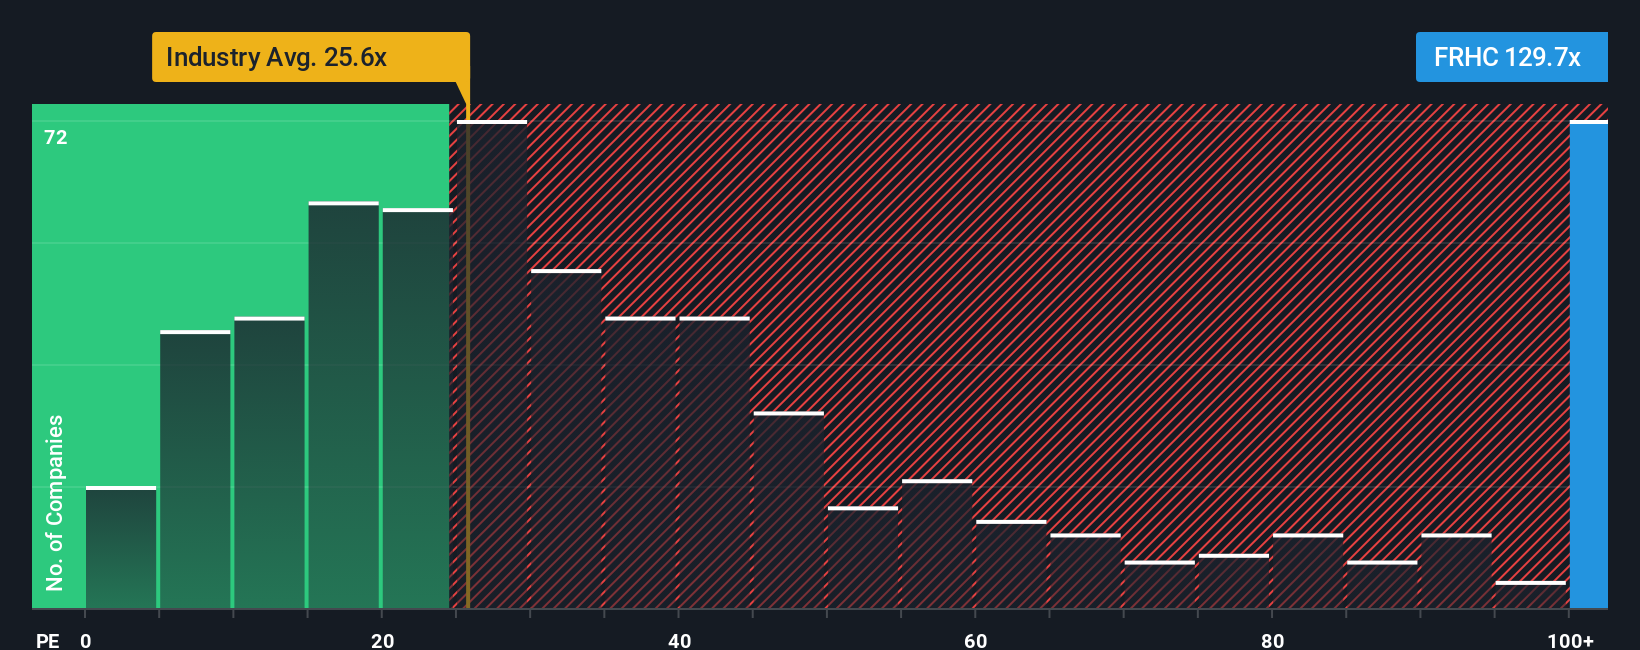
Currently, Freedom Holding is trading at a lofty PE ratio of 127.67x. This stands well above the Capital Markets industry average of 26.98x and the peer group average of 19.23x. These numbers suggest the market has extremely high expectations for Freedom Holding’s future growth and profitability.
This brings us to Simply Wall St’s “Fair Ratio” metric, which aims to move beyond surface-level comparisons. The Fair Ratio is calculated using a proprietary model that accounts for a company’s earnings growth, industry, profit margins, size, and risk factors. Because it factors in these unique characteristics, it provides a clearer, more personalized benchmark for valuation than industry or peer averages alone.
Comparing Freedom Holding’s current PE to its Fair Ratio gives us a more honest signal about where the stock stands. With a current PE of 127.67x and no significant premium justified by the Fair Ratio, the stock appears overvalued against this nuanced benchmark.
Result: OVERVALUED
PE ratios tell one story, but what if the real opportunity lies elsewhere? Discover companies where insiders are betting big on explosive growth.
Upgrade Your Decision Making: Choose your Freedom Holding Narrative
Earlier we mentioned that there is an even better way to understand valuation, so let us introduce you to Narratives. A Narrative is your chance to connect the story you see for a company, like Freedom Holding, with the numbers that matter—your expectations for future revenue, earnings, and profit margins—and to use these to estimate fair value.
In simple terms, a Narrative ties your personal view of a company's journey to a custom financial outlook, and then plugs that into a fair value calculation. Narratives are available on Simply Wall St’s Community page, making them an accessible and intuitive tool used by millions of investors.
With Narratives, you can quickly compare your Fair Value with the current market price to see if now might be a smart time to buy or sell. Because they update in real time when fresh news or earnings land, Narratives help you stay agile with your decisions.
For instance, while one investor’s Narrative for Freedom Holding might place fair value at $70 per share, another could see it as high as $140, reflecting unique takes on the company’s prospects. Narratives empower you to invest with your informed perspective, not just the crowd’s.
Do you think there's more to the story for Freedom Holding? Create your own Narrative to let the Community know!
This article by Simply Wall St is general in nature. We provide commentary based on historical data and analyst forecasts only using an unbiased methodology and our articles are not intended to be financial advice. It does not constitute a recommendation to buy or sell any stock, and does not take account of your objectives, or your financial situation. We aim to bring you long-term focused analysis driven by fundamental data. Note that our analysis may not factor in the latest price-sensitive company announcements or qualitative material. Simply Wall St has no position in any stocks mentioned.
New: AI Stock Screener & Alerts
Our new AI Stock Screener scans the market every day to uncover opportunities.
• Dividend Powerhouses (3%+ Yield)
• Undervalued Small Caps with Insider Buying
• High growth Tech and AI Companies
Or build your own from over 50 metrics.
Have feedback on this article? Concerned about the content? Get in touch with us directly. Alternatively, email editorial-team@simplywallst.com
About NasdaqCM:FRHC
Freedom Holding
Through its subsidiaries, provides securities brokerage, securities dealing, market making, investment research, investment counseling, retail and commercial banking, and insurance products.
Questionable track record with imperfect balance sheet.
Similar Companies
Market Insights

Advertisement
Community Narratives
The Next Phase of Energy Storage: How NeoVolta Is Tackling America’s Power Crunch
Fair Value US$7.50|30.4% undervalued
MA
Community Contributor
A formidable player in AI and enterprise computing.
Fair Value US$210.00|3.0% undervalued
CO
Community Contributor
IREN's Bold Moves in Sustainable Bitcoin Mining & AI Data Centers
Fair Value US$72.52|20.4% undervalued
BL
Community Contributor
Cooling the Champions: The Aussie Tech Behind F1's Victories
Fair Value AU$12.40|38.1% undervalued
TR
Community Contributor