- United States
- /
- Capital Markets
- /
- NasdaqCM:FRHC
Investing in Freedom Holding (NASDAQ:FRHC) five years ago would have delivered you a 793% gain

For many, the main point of investing in the stock market is to achieve spectacular returns. And highest quality companies can see their share prices grow by huge amounts. For example, the Freedom Holding Corp. (NASDAQ:FRHC) share price is up a whopping 793% in the last half decade, a handsome return for long term holders. If that doesn't get you thinking about long term investing, we don't know what will. Also pleasing for shareholders was the 31% gain in the last three months. Anyone who held for that rewarding ride would probably be keen to talk about it.
With that in mind, it's worth seeing if the company's underlying fundamentals have been the driver of long term performance, or if there are some discrepancies.
Check out our latest analysis for Freedom Holding
There is no denying that markets are sometimes efficient, but prices do not always reflect underlying business performance. By comparing earnings per share (EPS) and share price changes over time, we can get a feel for how investor attitudes to a company have morphed over time.
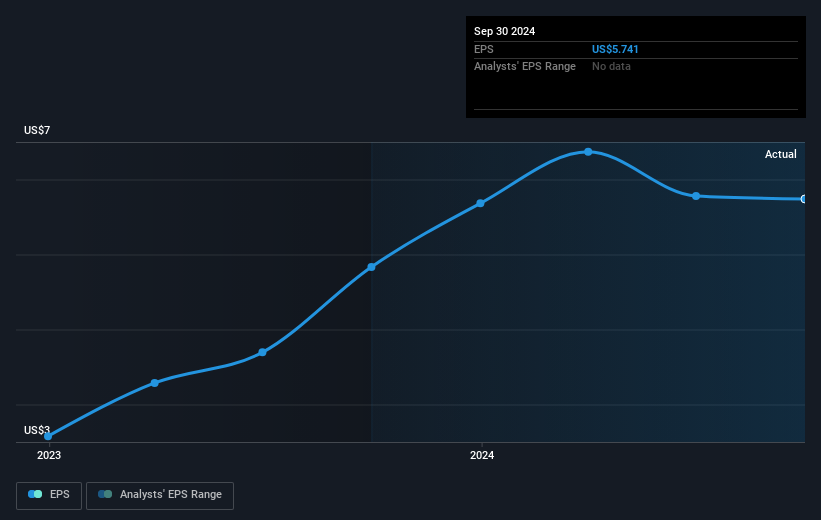
During five years of share price growth, Freedom Holding achieved compound earnings per share (EPS) growth of 63% per year. So the EPS growth rate is rather close to the annualized share price gain of 55% per year. This indicates that investor sentiment towards the company has not changed a great deal. Rather, the share price has approximately tracked EPS growth.
The graphic below depicts how EPS has changed over time (unveil the exact values by clicking on the image).

It might be well worthwhile taking a look at our free report on Freedom Holding's earnings, revenue and cash flow.
A Different Perspective
It's good to see that Freedom Holding has rewarded shareholders with a total shareholder return of 64% in the last twelve months. Since the one-year TSR is better than the five-year TSR (the latter coming in at 55% per year), it would seem that the stock's performance has improved in recent times. In the best case scenario, this may hint at some real business momentum, implying that now could be a great time to delve deeper. I find it very interesting to look at share price over the long term as a proxy for business performance. But to truly gain insight, we need to consider other information, too. For instance, we've identified 1 warning sign for Freedom Holding that you should be aware of.
If you are like me, then you will not want to miss this free list of undervalued small caps that insiders are buying.
Please note, the market returns quoted in this article reflect the market weighted average returns of stocks that currently trade on American exchanges.
New: AI Stock Screener & Alerts
Our new AI Stock Screener scans the market every day to uncover opportunities.
• Dividend Powerhouses (3%+ Yield)
• Undervalued Small Caps with Insider Buying
• High growth Tech and AI Companies
Or build your own from over 50 metrics.
Have feedback on this article? Concerned about the content? Get in touch with us directly. Alternatively, email editorial-team (at) simplywallst.com.
This article by Simply Wall St is general in nature. We provide commentary based on historical data and analyst forecasts only using an unbiased methodology and our articles are not intended to be financial advice. It does not constitute a recommendation to buy or sell any stock, and does not take account of your objectives, or your financial situation. We aim to bring you long-term focused analysis driven by fundamental data. Note that our analysis may not factor in the latest price-sensitive company announcements or qualitative material. Simply Wall St has no position in any stocks mentioned.
About NasdaqCM:FRHC
Freedom Holding
Through its subsidiaries, provides securities brokerage, securities dealing, market making, investment research, investment counseling, and investment banking services.
Adequate balance sheet with questionable track record.
Similar Companies
Market Insights
Community Narratives


