
Advertisement
- United States
- /
- Consumer Finance
- /
- NasdaqGM:DAVE
Dave Inc.'s (NASDAQ:DAVE) P/S Is Still On The Mark Following 48% Share Price Bounce
Dave Inc. (NASDAQ:DAVE) shareholders would be excited to see that the share price has had a great month, posting a 48% gain and recovering from prior weakness. The annual gain comes to 132% following the latest surge, making investors sit up and take notice.
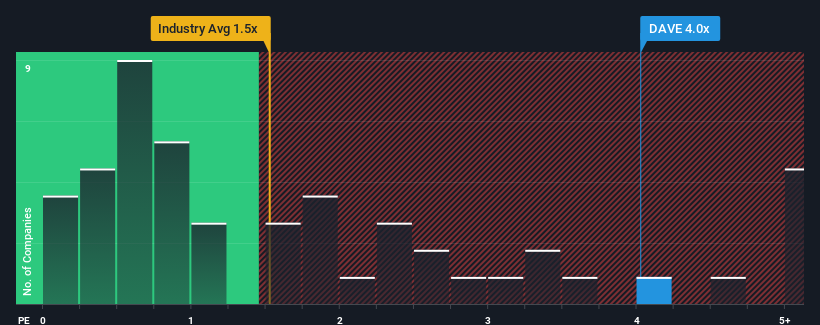
Following the firm bounce in price, when almost half of the companies in the United States' Consumer Finance industry have price-to-sales ratios (or "P/S") below 1.5x, you may consider Dave as a stock not worth researching with its 4x P/S ratio. Nonetheless, we'd need to dig a little deeper to determine if there is a rational basis for the highly elevated P/S.
We've discovered 1 warning sign about Dave. View them for free.Check out our latest analysis for Dave
How Has Dave Performed Recently?
Recent times have been advantageous for Dave as its revenues have been rising faster than most other companies. It seems that many are expecting the strong revenue performance to persist, which has raised the P/S. If not, then existing shareholders might be a little nervous about the viability of the share price.
If you'd like to see what analysts are forecasting going forward, you should check out our free report on Dave.Is There Enough Revenue Growth Forecasted For Dave?
The only time you'd be truly comfortable seeing a P/S as steep as Dave's is when the company's growth is on track to outshine the industry decidedly.
Taking a look back first, we see that the company grew revenue by an impressive 34% last year. The latest three year period has also seen an excellent 127% overall rise in revenue, aided by its short-term performance. Therefore, it's fair to say the revenue growth recently has been superb for the company.
Looking ahead now, revenue is anticipated to climb by 18% per annum during the coming three years according to the eight analysts following the company. That's shaping up to be materially higher than the 14% each year growth forecast for the broader industry.
With this information, we can see why Dave is trading at such a high P/S compared to the industry. Apparently shareholders aren't keen to offload something that is potentially eyeing a more prosperous future.
The Final Word
The strong share price surge has lead to Dave's P/S soaring as well. Typically, we'd caution against reading too much into price-to-sales ratios when settling on investment decisions, though it can reveal plenty about what other market participants think about the company.
Our look into Dave shows that its P/S ratio remains high on the merit of its strong future revenues. It appears that shareholders are confident in the company's future revenues, which is propping up the P/S. Unless these conditions change, they will continue to provide strong support to the share price.
Before you settle on your opinion, we've discovered 1 warning sign for Dave that you should be aware of.
If these risks are making you reconsider your opinion on Dave, explore our interactive list of high quality stocks to get an idea of what else is out there.
New: Manage All Your Stock Portfolios in One Place
We've created the ultimate portfolio companion for stock investors, and it's free.
• Connect an unlimited number of Portfolios and see your total in one currency
• Be alerted to new Warning Signs or Risks via email or mobile
• Track the Fair Value of your stocks
Have feedback on this article? Concerned about the content? Get in touch with us directly. Alternatively, email editorial-team (at) simplywallst.com.
This article by Simply Wall St is general in nature. We provide commentary based on historical data and analyst forecasts only using an unbiased methodology and our articles are not intended to be financial advice. It does not constitute a recommendation to buy or sell any stock, and does not take account of your objectives, or your financial situation. We aim to bring you long-term focused analysis driven by fundamental data. Note that our analysis may not factor in the latest price-sensitive company announcements or qualitative material. Simply Wall St has no position in any stocks mentioned.
About NasdaqGM:DAVE
Dave
Provides various financial products and services through its financial services platform in the United States.
Outstanding track record with excellent balance sheet.
Similar Companies
Market Insights

Advertisement
Community Narratives
MicroVision will explode future revenue by 380.37% with a vision towards success
Fair Value US$60|98.4% undervalued
TH
Community Contributor
The Indispensable Artery for a New North American Economy
Fair Value CA$132.87|0.7% overvalued
TI
Community Contributor
Recently Updated Narratives
CO

composite32 on Astor Enerji ·
Astor Enerji will surge with a fair value of $140.43 in the next 3 years
Fair Value:₺140.4335.5% undervalued
1 followerusers have followed this narrative
0 commentsusers have commented on this narrative
0 likesusers have liked this narrative
RE

RecMag on Proximus ·
Proximus: The State-Backed Backup Plan with 7% Gross Yield and 15% Currency Upside.
Fair Value:€17.1356.7% undervalued
30 followersusers have followed this narrative
0 commentsusers have commented on this narrative
0 likesusers have liked this narrative
AG


Agricola on IMPACT Silver ·
A case for for IMPACT Silver Corp (TSXV:IPT) to reach USD $4.52 (CAD $6.16) in 2026 (23 bagger in 1 year) and USD $5.76 (CAD $7.89) by 2030
Fair Value:CA$7.8996.2% undervalued
1 followerusers have followed this narrative
0 commentsusers have commented on this narrative
0 likesusers have liked this narrative
Popular Narratives
TH

TheWallstreetKing on MicroVision ·
MicroVision will explode future revenue by 380.37% with a vision towards success
Fair Value:US$6098.4% undervalued
101 followersusers have followed this narrative
10 commentsusers have commented on this narrative
20 likesusers have liked this narrative
AN


AnalystConsensusTarget on NVIDIA ·
NVDA: Expanding AI Demand Will Drive Major Data Center Investments Through 2026
Fair Value:US$250.3929.3% undervalued
932 followersusers have followed this narrative
6 commentsusers have commented on this narrative
23 likesusers have liked this narrative
OS


oscargarcia on Alphabet ·
The company that turned a verb into a global necessity and basically runs the modern internet, digital ads, smartphones, maps, and AI.
Fair Value:US$3405.8% undervalued
140 followersusers have followed this narrative
6 commentsusers have commented on this narrative
18 likesusers have liked this narrative