Advertisement
- United States
- /
- Capital Markets
- /
- NasdaqCM:BULL
Should You Rethink Webull After Shares Fall 20% Despite Steady Earnings Outlook?

Simply Wall St
Reviewed by Bailey Pemberton
Trying to figure out what to do with Webull stock after a rollercoaster of price moves this year? You’re not alone. Many investors are watching closely, wondering if the recent dip is a red flag or an opportunity hiding in plain sight. Webull’s stock has seen some sharp swings lately, dropping 19.7% over the past week and 14.6% over the last month. While those numbers might feel dramatic, in perspective, the one-year return sits almost flat at -0.1%, and the three-year view still shows a healthy 14.5% gain.
What is driving these moves? Like many digital trading platforms, Webull has been influenced by broader market shifts and changing investor sentiment about the risks and rewards of online brokers. With new regulations on the horizon and competition heating up, volatility is to be expected. Yet, the company continues to weather the storm better than many expected. This could explain why some investors are keeping faith.
If you’re crunching the numbers, you’ll want to know that Webull scores a 3 out of 6 on our value checklist. That means the stock shows up as undervalued on half of our most important valuation tests, but there is still room for debate. This setup makes a deeper dive worthwhile.
Coming up, we will walk through the major valuation methods and what they say about Webull’s current price. If you are looking for a smarter approach to understanding stock value, keep reading until the end as we reveal our favorite lens for putting all these pieces together.
Why Webull is lagging behind its peers
Approach 1: Webull Discounted Cash Flow (DCF) Analysis
The Discounted Cash Flow (DCF) model is a valuation approach that estimates a company’s intrinsic worth by projecting its future cash flows and then discounting them back to today’s values. In this way, investors can see what all those future earnings are actually worth in present dollars.
For Webull, the latest Free Cash Flow stands at approximately $385.5 million. Projections over the next decade show steady growth, with the forecasted Free Cash Flow in 2035 reaching about $887.6 million, according to analyst estimates and further extrapolation. Each year, these anticipated cash flows are discounted to reflect their value in today’s terms, ensuring a realistic assessment based on prevailing risks and opportunity costs.
- 2026 projected FCF: $465.8 million (discounted to $430.9 million)
- 2028 projected FCF: $601.2 million (discounted to $476.1 million)
- 2030 projected FCF: $704.5 million (discounted to $477.6 million)
- 2035 projected FCF: $887.6 million (discounted to $407.9 million)
Based on this DCF analysis, Webull’s intrinsic value is estimated at $26.14 per share. This means the stock is trading at a 56.4% discount relative to its fair value. This substantial undervaluation may be of interest to value-focused investors.
Result: UNDERVALUED
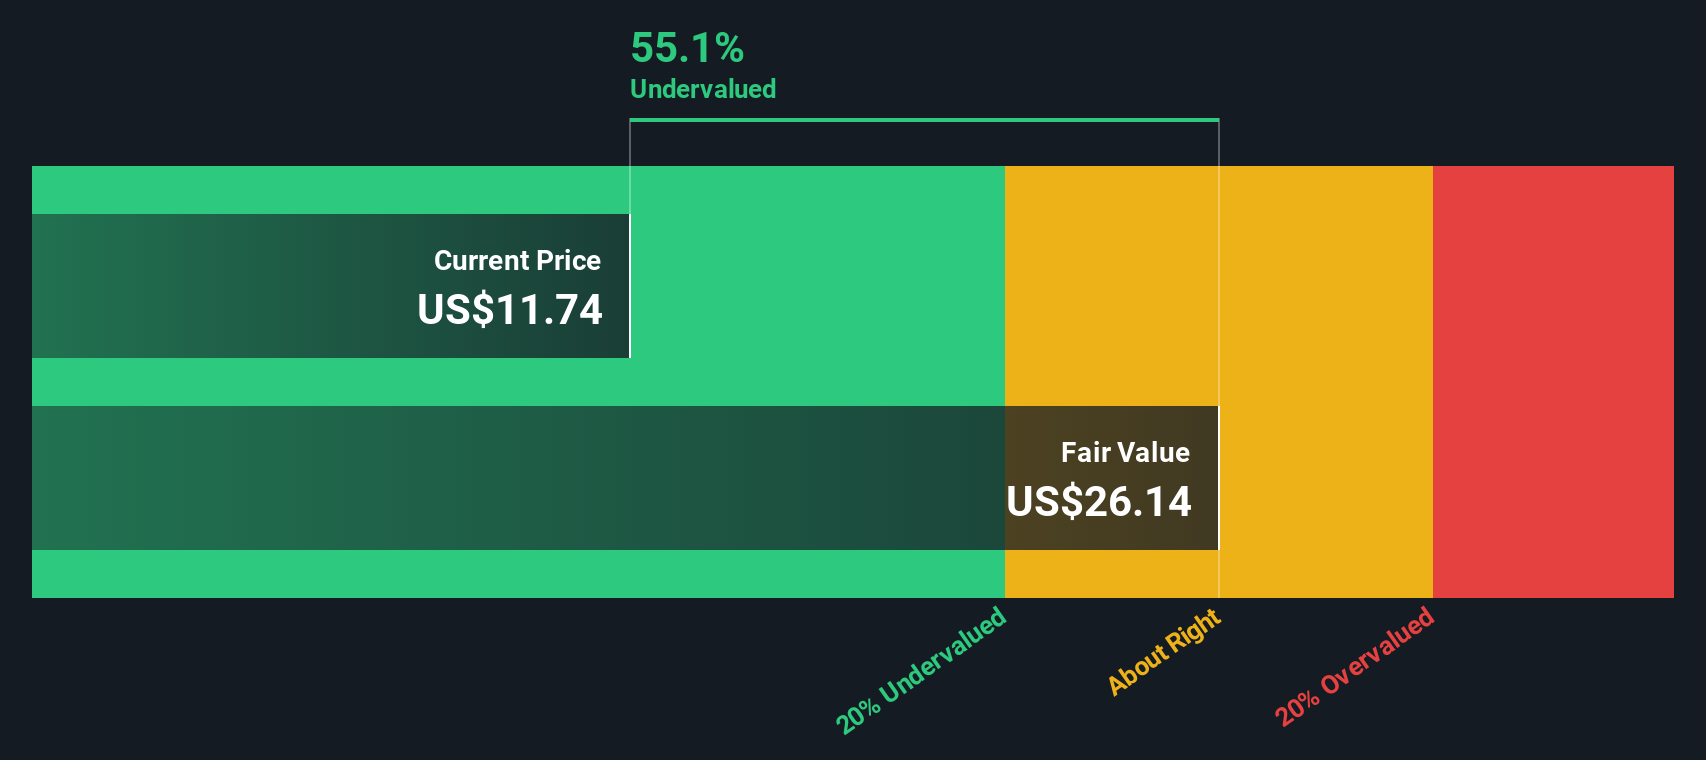
Our Discounted Cash Flow (DCF) analysis suggests Webull is undervalued by 56.4%. Track this in your watchlist or portfolio, or discover more undervalued stocks.
Approach 2: Webull Price vs Earnings (PE)
For profitable companies like Webull, the Price-to-Earnings (PE) ratio is one of the most widely used metrics to assess valuation. It helps investors understand how much they are paying for each dollar of earnings, making it a straightforward tool for comparing companies within the same industry.
Growth expectations and risk play a role in what a “normal” PE ratio should be. Fast-growing businesses with strong earnings potential generally command higher PE ratios. In contrast, companies facing uncertainty or below-average growth tend to trade at lower multiples. The industry average PE in Capital Markets is currently 24.9x, while Webull’s key peers trade around 19.0x. By comparison, Webull stands out with a PE ratio of 75.3x, indicating that investors are pricing in strong earnings growth or perhaps a premium for perceived quality or future upside.
To add more nuance, the “Fair Ratio” calculated by Simply Wall St takes into account important factors like the company’s earnings growth prospects, industry dynamics, profit margins, market capitalization, and risk profile. Rather than just benchmarking against general industry or peer multiples, the Fair Ratio offers a tailored expectation for what Webull’s PE should be, given its unique profile. For Webull, the Fair Ratio is estimated at 83.2x, notably higher than both its current PE and the industry standard. This proprietary approach helps avoid misleading conclusions that might arise from generic comparisons.
Comparing the Fair Ratio (83.2x) with Webull’s actual PE (75.3x) suggests the stock is trading at a slight discount relative to its growth and profitability potential. The gap, however, is not dramatic, which means the price is close to justified based on fundamentals.
Result: ABOUT RIGHT

PE ratios tell one story, but what if the real opportunity lies elsewhere? Discover companies where insiders are betting big on explosive growth.
Upgrade Your Decision Making: Choose your Webull Narrative
Earlier, we mentioned that there is an even better way to understand valuation, so let us introduce you to Narratives. A Narrative is your own story about what you think will happen to a company, grounded in your assumptions about future revenue, profits, and business trends. It connects the “why” of a business, such as new products, international expansion, or shifting market dynamics, to a realistic financial forecast and, eventually, to a unique fair value calculation.
This approach is both simple and powerful, and it is easily accessible to anyone using Simply Wall St’s Community page, where millions of investors share and update their Narratives. Narratives guide your decisions by directly comparing your calculated Fair Value to today’s share price, helping you decide if now is the time to buy or sell, based on your view and not just published analyst targets.
Best of all, Narratives keep pace with the real world: when news or earnings surprises hit, assumptions and fair values can be updated instantly to reflect the new information. For example, some investors see Webull’s global expansion and crypto growth as catalysts that justify a $18.50 per share fair value, while others, more cautious about competition and regulatory risks, believe a lower figure closer to $12.93 is warranted. Your Narrative reflects your unique point of view and conviction.
Do you think there's more to the story for Webull? Create your own Narrative to let the Community know!
This article by Simply Wall St is general in nature. We provide commentary based on historical data and analyst forecasts only using an unbiased methodology and our articles are not intended to be financial advice. It does not constitute a recommendation to buy or sell any stock, and does not take account of your objectives, or your financial situation. We aim to bring you long-term focused analysis driven by fundamental data. Note that our analysis may not factor in the latest price-sensitive company announcements or qualitative material. Simply Wall St has no position in any stocks mentioned.
Valuation is complex, but we're here to simplify it.
Discover if Webull might be undervalued or overvalued with our detailed analysis, featuring fair value estimates, potential risks, dividends, insider trades, and its financial condition.
Access Free AnalysisHave feedback on this article? Concerned about the content? Get in touch with us directly. Alternatively, email editorial-team@simplywallst.com
About NasdaqCM:BULL
High growth potential with adequate balance sheet.
Market Insights

Advertisement
Community Narratives
A formidable player in AI and enterprise computing.
Fair Value US$210.00|12.2% overvalued
CO
Community Contributor
IREN's Bold Moves in Sustainable Bitcoin Mining & AI Data Centers
Fair Value US$72.52|17.1% undervalued
BL
Community Contributor
Cooling the Champions: The Aussie Tech Behind F1's Victories
Fair Value AU$12.40|38.7% undervalued
TR
Community Contributor