
Advertisement
- United States
- /
- Consumer Services
- /
- NYSE:SCI
Service Corporation International (NYSE:SCI) stock performs better than its underlying earnings growth over last five years

When you buy shares in a company, it's worth keeping in mind the possibility that it could fail, and you could lose your money. But on a lighter note, a good company can see its share price rise well over 100%. For example, the Service Corporation International (NYSE:SCI) share price has soared 104% in the last half decade. Most would be very happy with that. In more good news, the share price has risen 10% in thirty days. This could be related to the recent financial results that were recently released - you could check the most recent data by reading our company report.
On the back of a solid 7-day performance, let's check what role the company's fundamentals have played in driving long term shareholder returns.
Check out our latest analysis for Service Corporation International
While markets are a powerful pricing mechanism, share prices reflect investor sentiment, not just underlying business performance. One flawed but reasonable way to assess how sentiment around a company has changed is to compare the earnings per share (EPS) with the share price.
During five years of share price growth, Service Corporation International achieved compound earnings per share (EPS) growth of 12% per year. This EPS growth is lower than the 15% average annual increase in the share price. This suggests that market participants hold the company in higher regard, these days. And that's hardly shocking given the track record of growth.
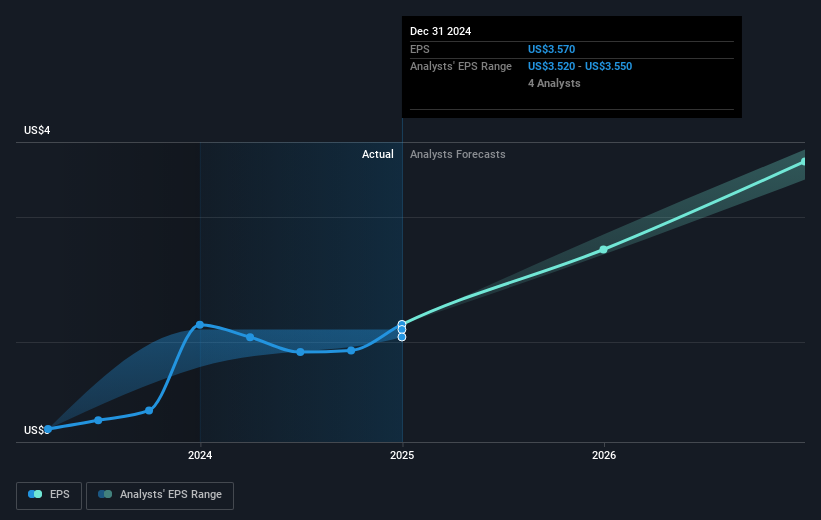
You can see below how EPS has changed over time (discover the exact values by clicking on the image).
Before buying or selling a stock, we always recommend a close examination of historic growth trends, available here.
What About Dividends?
When looking at investment returns, it is important to consider the difference between total shareholder return (TSR) and share price return. The TSR is a return calculation that accounts for the value of cash dividends (assuming that any dividend received was reinvested) and the calculated value of any discounted capital raisings and spin-offs. Arguably, the TSR gives a more comprehensive picture of the return generated by a stock. As it happens, Service Corporation International's TSR for the last 5 years was 120%, which exceeds the share price return mentioned earlier. The dividends paid by the company have thusly boosted the total shareholder return.
A Different Perspective
It's good to see that Service Corporation International has rewarded shareholders with a total shareholder return of 14% in the last twelve months. Of course, that includes the dividend. Having said that, the five-year TSR of 17% a year, is even better. It's always interesting to track share price performance over the longer term. But to understand Service Corporation International better, we need to consider many other factors. Consider for instance, the ever-present spectre of investment risk. We've identified 1 warning sign with Service Corporation International , and understanding them should be part of your investment process.
Of course Service Corporation International may not be the best stock to buy. So you may wish to see this free collection of growth stocks.
Please note, the market returns quoted in this article reflect the market weighted average returns of stocks that currently trade on American exchanges.
New: Manage All Your Stock Portfolios in One Place
We've created the ultimate portfolio companion for stock investors, and it's free.
• Connect an unlimited number of Portfolios and see your total in one currency
• Be alerted to new Warning Signs or Risks via email or mobile
• Track the Fair Value of your stocks
Have feedback on this article? Concerned about the content? Get in touch with us directly. Alternatively, email editorial-team (at) simplywallst.com.
This article by Simply Wall St is general in nature. We provide commentary based on historical data and analyst forecasts only using an unbiased methodology and our articles are not intended to be financial advice. It does not constitute a recommendation to buy or sell any stock, and does not take account of your objectives, or your financial situation. We aim to bring you long-term focused analysis driven by fundamental data. Note that our analysis may not factor in the latest price-sensitive company announcements or qualitative material. Simply Wall St has no position in any stocks mentioned.
About NYSE:SCI
Service Corporation International
Provides deathcare products and services in the United States and Canada.
Average dividend payer with limited growth.
Similar Companies
Market Insights

Advertisement
Community Narratives
Enterprise, AI & Cloud Growth Ahead, Waiting For the Right Price 💸
Fair Value US$204.74|5.4% overvalued
FR
Community Contributor
Good foundation, but now it's all about the next steps
Fair Value US$147.87|28.9% undervalued
TO
Community Contributor
XTB's Path to 100–120 PLN by 2028 Amid Market Volatility
Fair Value zł100.96|36.6% undervalued
DZ
Community Contributor