
Advertisement
- United States
- /
- Consumer Services
- /
- NYSE:DAO
Youdao, Inc.'s (NYSE:DAO) P/S Is Still On The Mark Following 30% Share Price Bounce

Those holding Youdao, Inc. (NYSE:DAO) shares would be relieved that the share price has rebounded 30% in the last thirty days, but it needs to keep going to repair the recent damage it has caused to investor portfolios. The annual gain comes to 140% following the latest surge, making investors sit up and take notice.
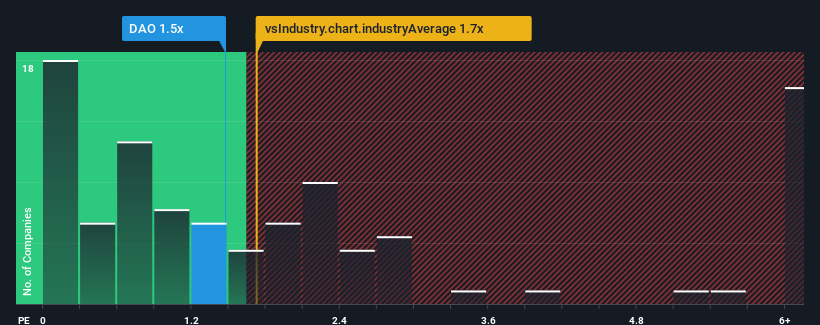
Even after such a large jump in price, there still wouldn't be many who think Youdao's price-to-sales (or "P/S") ratio of 1.5x is worth a mention when the median P/S in the United States' Consumer Services industry is similar at about 1.7x. However, investors might be overlooking a clear opportunity or potential setback if there is no rational basis for the P/S.
We've discovered 2 warning signs about Youdao. View them for free.View our latest analysis for Youdao
What Does Youdao's P/S Mean For Shareholders?
Youdao hasn't been tracking well recently as its declining revenue compares poorly to other companies, which have seen some growth in their revenues on average. Perhaps the market is expecting its poor revenue performance to improve, keeping the P/S from dropping. However, if this isn't the case, investors might get caught out paying too much for the stock.
Keen to find out how analysts think Youdao's future stacks up against the industry? In that case, our free report is a great place to start.Is There Some Revenue Growth Forecasted For Youdao?
Youdao's P/S ratio would be typical for a company that's only expected to deliver moderate growth, and importantly, perform in line with the industry.
Retrospectively, the last year delivered a frustrating 1.5% decrease to the company's top line. This has soured the latest three-year period, which nevertheless managed to deliver a decent 30% overall rise in revenue. So we can start by confirming that the company has generally done a good job of growing revenue over that time, even though it had some hiccups along the way.
Looking ahead now, revenue is anticipated to climb by 15% during the coming year according to the seven analysts following the company. Meanwhile, the rest of the industry is forecast to expand by 13%, which is not materially different.
With this information, we can see why Youdao is trading at a fairly similar P/S to the industry. It seems most investors are expecting to see average future growth and are only willing to pay a moderate amount for the stock.
What Does Youdao's P/S Mean For Investors?
Youdao's stock has a lot of momentum behind it lately, which has brought its P/S level with the rest of the industry. We'd say the price-to-sales ratio's power isn't primarily as a valuation instrument but rather to gauge current investor sentiment and future expectations.
Our look at Youdao's revenue growth estimates show that its P/S is about what we expect, as both metrics follow closely with the industry averages. At this stage investors feel the potential for an improvement or deterioration in revenue isn't great enough to push P/S in a higher or lower direction. If all things remain constant, the possibility of a drastic share price movement remains fairly remote.
We don't want to rain on the parade too much, but we did also find 2 warning signs for Youdao that you need to be mindful of.
If companies with solid past earnings growth is up your alley, you may wish to see this free collection of other companies with strong earnings growth and low P/E ratios.
New: Manage All Your Stock Portfolios in One Place
We've created the ultimate portfolio companion for stock investors, and it's free.
• Connect an unlimited number of Portfolios and see your total in one currency
• Be alerted to new Warning Signs or Risks via email or mobile
• Track the Fair Value of your stocks
Have feedback on this article? Concerned about the content? Get in touch with us directly. Alternatively, email editorial-team (at) simplywallst.com.
This article by Simply Wall St is general in nature. We provide commentary based on historical data and analyst forecasts only using an unbiased methodology and our articles are not intended to be financial advice. It does not constitute a recommendation to buy or sell any stock, and does not take account of your objectives, or your financial situation. We aim to bring you long-term focused analysis driven by fundamental data. Note that our analysis may not factor in the latest price-sensitive company announcements or qualitative material. Simply Wall St has no position in any stocks mentioned.
About NYSE:DAO
Youdao
An internet technology company, provides online services in the fields of content, community, communication, and commerce in China.
Reasonable growth potential with acceptable track record.
Similar Companies
Market Insights

Advertisement
Community Narratives

Apple: A Dying Star with an Overpriced Valuation
Fair Value US$177.34|19.2% overvalued
IN
Community Contributor
Avino a case for USD$20 per share within 5 years (assuming $3,500 gold, $100 silver and $4 copper).
Fair Value CA$26.79|86.0% undervalued
AG
Community Contributor
Riding the Defense Boom RENK Sees Revenue Climb at 15% CAGR by FY 2029
Fair Value €69.87|20.5% undervalued
CH
Community Contributor