- United States
- /
- Hospitality
- /
- NasdaqGS:PENN
Are PENN Entertainment, Inc.'s (NASDAQ:PENN) Mixed Financials The Reason For Its Gloomy Performance on The Stock Market?


PENN Entertainment (NASDAQ:PENN) has had a rough three months with its share price down 3.9%. It seems that the market might have completely ignored the positive aspects of the company's fundamentals and decided to weigh-in more on the negative aspects. Fundamentals usually dictate market outcomes so it makes sense to study the company's financials. In this article, we decided to focus on PENN Entertainment's ROE.
Return on Equity or ROE is a test of how effectively a company is growing its value and managing investors’ money. Simply put, it is used to assess the profitability of a company in relation to its equity capital.
View our latest analysis for PENN Entertainment
How Is ROE Calculated?
Return on equity can be calculated by using the formula:
Return on Equity = Net Profit (from continuing operations) ÷ Shareholders' Equity
So, based on the above formula, the ROE for PENN Entertainment is:
6.2% = US$222m ÷ US$3.6b (Based on the trailing twelve months to December 2022).
The 'return' is the income the business earned over the last year. Another way to think of that is that for every $1 worth of equity, the company was able to earn $0.06 in profit.
What Is The Relationship Between ROE And Earnings Growth?
Thus far, we have learned that ROE measures how efficiently a company is generating its profits. Depending on how much of these profits the company reinvests or "retains", and how effectively it does so, we are then able to assess a company’s earnings growth potential. Assuming all else is equal, companies that have both a higher return on equity and higher profit retention are usually the ones that have a higher growth rate when compared to companies that don't have the same features.
PENN Entertainment's Earnings Growth And 6.2% ROE
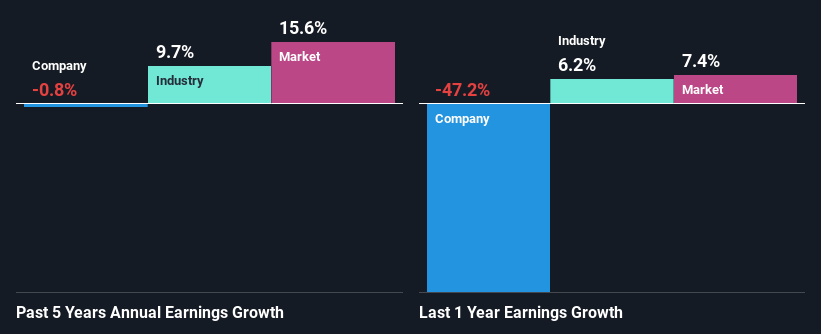
When you first look at it, PENN Entertainment's ROE doesn't look that attractive. Next, when compared to the average industry ROE of 18%, the company's ROE leaves us feeling even less enthusiastic. Hence, the flat earnings seen by PENN Entertainment over the past five years could probably be the result of it having a lower ROE.
We then compared PENN Entertainment's net income growth with the industry and found that the average industry growth rate was 9.7% in the same period.
Earnings growth is a huge factor in stock valuation. The investor should try to establish if the expected growth or decline in earnings, whichever the case may be, is priced in. By doing so, they will have an idea if the stock is headed into clear blue waters or if swampy waters await. What is PENN worth today? The intrinsic value infographic in our free research report helps visualize whether PENN is currently mispriced by the market.
Is PENN Entertainment Using Its Retained Earnings Effectively?
PENN Entertainment doesn't pay any dividend, meaning that potentially all of its profits are being reinvested in the business. However, this doesn't explain why the company hasn't seen any growth. So there might be other factors at play here which could potentially be hampering growth. For example, the business has faced some headwinds.
Summary
In total, we're a bit ambivalent about PENN Entertainment's performance. While the company does have a high rate of profit retention, its low rate of return is probably hampering its earnings growth. Having said that, looking at current analyst estimates, we found that the company's earnings growth rate is expected to see a huge improvement. To know more about the company's future earnings growth forecasts take a look at this free report on analyst forecasts for the company to find out more.
New: Manage All Your Stock Portfolios in One Place
We've created the ultimate portfolio companion for stock investors, and it's free.
• Connect an unlimited number of Portfolios and see your total in one currency
• Be alerted to new Warning Signs or Risks via email or mobile
• Track the Fair Value of your stocks
Have feedback on this article? Concerned about the content? Get in touch with us directly. Alternatively, email editorial-team (at) simplywallst.com.
This article by Simply Wall St is general in nature. We provide commentary based on historical data and analyst forecasts only using an unbiased methodology and our articles are not intended to be financial advice. It does not constitute a recommendation to buy or sell any stock, and does not take account of your objectives, or your financial situation. We aim to bring you long-term focused analysis driven by fundamental data. Note that our analysis may not factor in the latest price-sensitive company announcements or qualitative material. Simply Wall St has no position in any stocks mentioned.
About NasdaqGS:PENN
PENN Entertainment
Provides integrated entertainment, sports content, and casino gaming experiences.
Undervalued with moderate growth potential.

