

To the annoyance of some shareholders, Collectors Universe (NASDAQ:CLCT) shares are down a considerable 31% in the last month. Indeed, the recent drop has reduced the annual gain to a relatively sedate 6.4% over the last twelve months.
Assuming nothing else has changed, a lower share price makes a stock more attractive to potential buyers. In the long term, share prices tend to follow earnings per share, but in the short term prices bounce around in response to short term factors (which are not always obvious). So, on certain occasions, long term focussed investors try to take advantage of pessimistic expectations to buy shares at a better price. Perhaps the simplest way to get a read on investors' expectations of a business is to look at its Price to Earnings Ratio (PE Ratio). A high P/E implies that investors have high expectations of what a company can achieve compared to a company with a low P/E ratio.
See our latest analysis for Collectors Universe
How Does Collectors Universe's P/E Ratio Compare To Its Peers?
Collectors Universe's P/E of 12.98 indicates relatively low sentiment towards the stock. If you look at the image below, you can see Collectors Universe has a lower P/E than the average (25.4) in the consumer services industry classification.
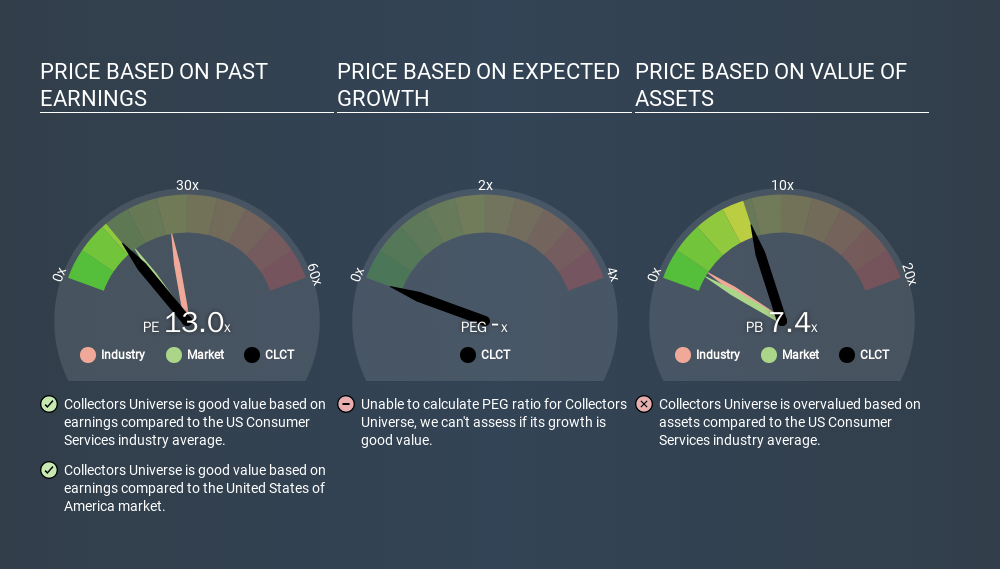
This suggests that market participants think Collectors Universe will underperform other companies in its industry. Since the market seems unimpressed with Collectors Universe, it's quite possible it could surprise on the upside. You should delve deeper. I like to check if company insiders have been buying or selling.
How Growth Rates Impact P/E Ratios
Earnings growth rates have a big influence on P/E ratios. If earnings are growing quickly, then the 'E' in the equation will increase faster than it would otherwise. That means even if the current P/E is high, it will reduce over time if the share price stays flat. A lower P/E should indicate the stock is cheap relative to others -- and that may attract buyers.
Collectors Universe's 105% EPS improvement over the last year was like bamboo growth after rain; rapid and impressive. Having said that, the average EPS growth over the last three years wasn't so good, coming in at 9.1%.
Don't Forget: The P/E Does Not Account For Debt or Bank Deposits
The 'Price' in P/E reflects the market capitalization of the company. That means it doesn't take debt or cash into account. Theoretically, a business can improve its earnings (and produce a lower P/E in the future) by investing in growth. That means taking on debt (or spending its cash).
Spending on growth might be good or bad a few years later, but the point is that the P/E ratio does not account for the option (or lack thereof).
Is Debt Impacting Collectors Universe's P/E?
Collectors Universe has net cash of US$20m. This is fairly high at 12% of its market capitalization. That might mean balance sheet strength is important to the business, but should also help push the P/E a bit higher than it would otherwise be.
The Bottom Line On Collectors Universe's P/E Ratio
Collectors Universe has a P/E of 13.0. That's around the same as the average in the US market, which is 13.3. The excess cash it carries is the gravy on top its fast EPS growth. So at a glance we're a bit surprised that Collectors Universe does not have a higher P/E ratio. Given Collectors Universe's P/E ratio has declined from 18.8 to 13.0 in the last month, we know for sure that the market is significantly less confident about the business today, than it was back then. For those who don't like to trade against momentum, that could be a warning sign, but a contrarian investor might want to take a closer look.
Investors should be looking to buy stocks that the market is wrong about. If it is underestimating a company, investors can make money by buying and holding the shares until the market corrects itself. Although we don't have analyst forecasts shareholders might want to examine this detailed historical graph of earnings, revenue and cash flow.
Of course, you might find a fantastic investment by looking at a few good candidates. So take a peek at this free list of companies with modest (or no) debt, trading on a P/E below 20.
If you spot an error that warrants correction, please contact the editor at editorial-team@simplywallst.com. This article by Simply Wall St is general in nature. It does not constitute a recommendation to buy or sell any stock, and does not take account of your objectives, or your financial situation. Simply Wall St has no position in the stocks mentioned.
We aim to bring you long-term focused research analysis driven by fundamental data. Note that our analysis may not factor in the latest price-sensitive company announcements or qualitative material. Thank you for reading.
Market Insights

Community Narratives


