Advertisement
- United States
- /
- Food and Staples Retail
- /
- NYSE:PFGC
How the Sysco Lawsuit Settlement Shapes Performance Food Group’s Current Stock Value

Simply Wall St
Reviewed by Bailey Pemberton
If you are sizing up what to do with shares of Performance Food Group, you are definitely not alone. With the stock closing recently at $103.54 and a notable 185.5% gain over the last five years, it has drawn significant attention from investors looking for consistent growth. The last month saw a slight 0.5% dip, but that's barely a blip compared to the company's 24.6% gain over the past year and a solid 23.2% surge since the start of this year. Even in the past week, the stock posted a 3.2% jump, fueling speculation about what is driving this steady climb.
Much of this performance reflects broader optimism around the food distribution sector, with changing consumer habits and supply chain adaptations making companies like Performance Food Group more attractive to investors reassessing risk. Still, the all-important question remains: is the stock actually undervalued, fairly valued, or stretched too far based on today’s fundamentals? If you are a value-minded investor, you will want to pay close attention to the company’s value score. Out of the six main financial checks analysts usually use to test for undervaluation, Performance Food Group scores a 2, indicating it is undervalued in two of those categories.
So how exactly is this score determined, and what do each of those valuation tests tell us about the stock’s true worth? Let's break down those approaches and, even more importantly, preview an even smarter way to judge real long-term value by the end of this article.
Performance Food Group scores just 2/6 on our valuation checks. See what other red flags we found in the full valuation breakdown.
Approach 1: Performance Food Group Discounted Cash Flow (DCF) Analysis
A Discounted Cash Flow (DCF) model estimates a company's true worth by predicting its future free cash flows and translating them into today’s dollars. For Performance Food Group, analysts and modeling tools first consider the company’s current Free Cash Flow, which stands at $792.95 Million. While analysts provide firm forecasts up to five years ahead, extended numbers use logical extrapolations based on recent performance trends.
Looking ahead, Performance Food Group is projected to steadily increase free cash flows, reaching $1.166 Billion by 2028 and climbing to $1.65 Billion by 2035. Each future year's cash flow is discounted back to the present value to reflect uncertainty and the time value of money. For these projections, Simply Wall St uses a 2 Stage Free Cash Flow to Equity model to ensure that both near-term analyst insights and longer-term trends are accounted for.
With this approach, Performance Food Group's intrinsic value calculates to $171.74 per share, significantly higher than its current trading price. The DCF model indicates the stock is trading at a 39.7% discount to its estimated fair value, suggesting substantial potential upside for value-seeking investors.
Result: UNDERVALUED

Our Discounted Cash Flow (DCF) analysis suggests Performance Food Group is undervalued by 39.7%. Track this in your watchlist or portfolio, or discover more undervalued stocks.
Approach 2: Performance Food Group Price vs Earnings
For established, profitable companies like Performance Food Group, the Price-to-Earnings (PE) ratio is often the most widely accepted measure of valuation. It reflects how much investors are willing to pay today for a dollar of earnings, making it useful for comparing companies with steady profits. Generally, higher anticipated earnings growth and lower risk justify a higher “normal” or “fair” PE ratio. In contrast, slower growth or more volatility tend to pull it down.
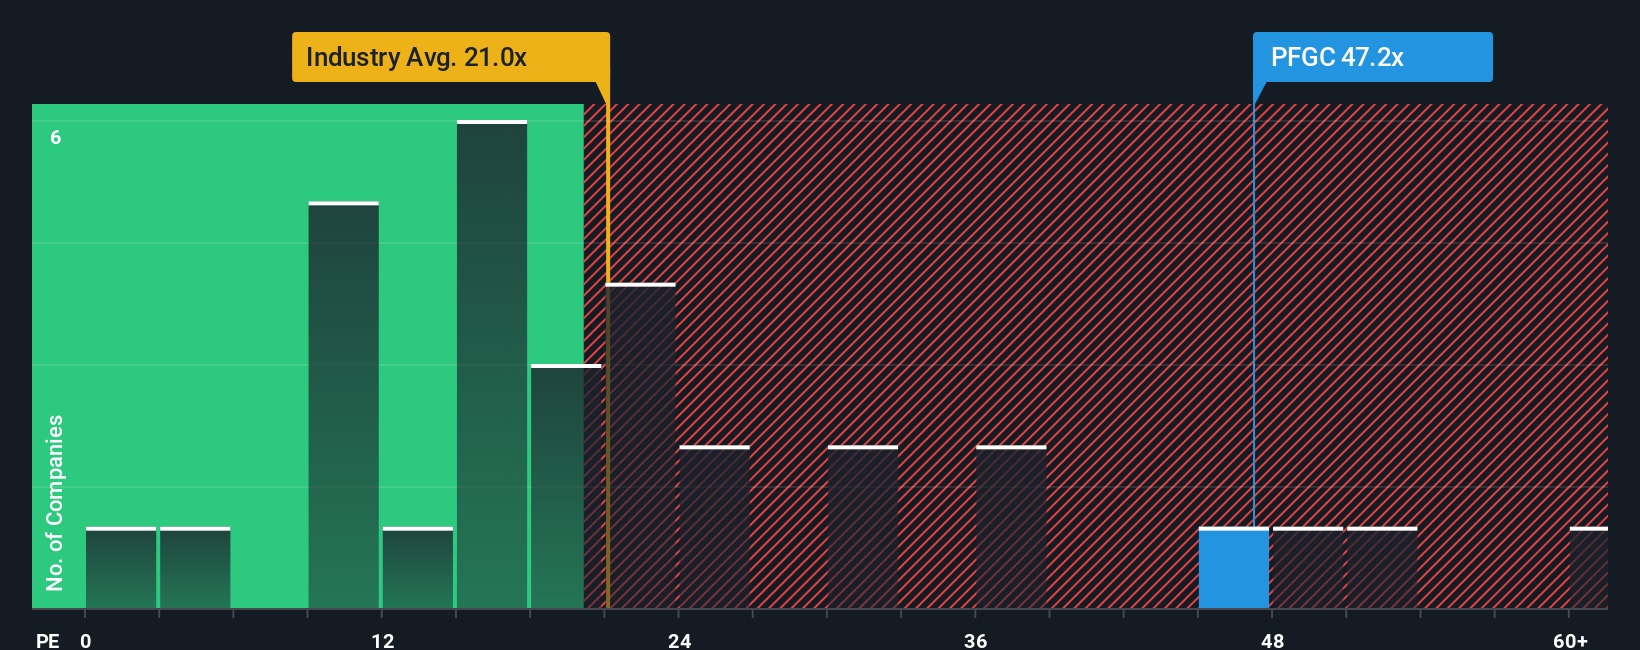
Performance Food Group currently trades at a PE ratio of 47.73x, which is considerably higher than both the average PE of comparable peers at 26.66x and the broader Consumer Retailing industry average of 21.44x. This suggests the market has high expectations for Performance Food Group relative to its sector. Rather than rely solely on peer or industry comparisons, investors can also consider Simply Wall St’s “Fair Ratio,” a proprietary measure that incorporates not just industry norms but also the company’s specific growth prospects, profit margins, market capitalization, and risk factors.
According to this framework, the Fair PE Ratio for Performance Food Group stands at 28.68x. Because this is well below the current market PE, it signals the shares are priced above what underlying fundamentals support, even considering their strengths. This more tailored approach offers a clearer, more nuanced sense of value compared to simply lining up similar company multiples.
Result: OVERVALUED
PE ratios tell one story, but what if the real opportunity lies elsewhere? Discover companies where insiders are betting big on explosive growth.
Upgrade Your Decision Making: Choose your Performance Food Group Narrative
Earlier we mentioned that there is an even better way to understand valuation, so let's introduce you to Narratives. A Narrative is more than just a number; it is your personal, data-driven story about a company’s future, connecting your perspective and assumptions (such as future revenue, earnings, and margins) to an estimated fair value. Narratives take you beyond simple ratios by linking the company’s business story to concrete financial forecasts, turning your outlook into an actionable estimate of what the stock is worth today.
This approach is both powerful and easy to use, especially since Narratives are available right on Simply Wall St’s Community page, with millions of investors already taking part. Narratives put you in the driver’s seat, letting you compare your own view of Performance Food Group’s fair value versus the current share price, so you can more confidently decide when to buy or sell. Even better, your Narrative gets dynamically updated as fresh news or company results come in, so your view can always reflect the latest events.
For example, the most optimistic Narrative for Performance Food Group currently sees a fair value of $127 per share, driven by strong digital sales and margin gains; while the most cautious investor pegs it at just $102, reflecting concerns about competition and sector risks.
Do you think there's more to the story for Performance Food Group? Create your own Narrative to let the Community know!

This article by Simply Wall St is general in nature. We provide commentary based on historical data and analyst forecasts only using an unbiased methodology and our articles are not intended to be financial advice. It does not constitute a recommendation to buy or sell any stock, and does not take account of your objectives, or your financial situation. We aim to bring you long-term focused analysis driven by fundamental data. Note that our analysis may not factor in the latest price-sensitive company announcements or qualitative material. Simply Wall St has no position in any stocks mentioned.
New: Manage All Your Stock Portfolios in One Place
We've created the ultimate portfolio companion for stock investors, and it's free.
• Connect an unlimited number of Portfolios and see your total in one currency
• Be alerted to new Warning Signs or Risks via email or mobile
• Track the Fair Value of your stocks
Have feedback on this article? Concerned about the content? Get in touch with us directly. Alternatively, email editorial-team@simplywallst.com
About NYSE:PFGC
Performance Food Group
Through its subsidiaries, engages in the marketing and distribution of food and food-related products in North America.
Moderate growth potential and slightly overvalued.
Similar Companies
Market Insights

Advertisement
Community Narratives
A formidable player in AI and enterprise computing.
Fair Value US$210.00|13.6% overvalued
CO
Community Contributor
IREN's Bold Moves in Sustainable Bitcoin Mining & AI Data Centers
Fair Value US$89.00|23.6% undervalued
BL
Community Contributor
Cooling the Champions: The Aussie Tech Behind F1's Victories
Fair Value AU$12.40|37.6% undervalued
TR
Community Contributor