- United States
- /
- Food and Staples Retail
- /
- NasdaqCM:MDVL
Slammed 31% MedAvail Holdings, Inc. (NASDAQ:MDVL) Screens Well Here But There Might Be A Catch


MedAvail Holdings, Inc. (NASDAQ:MDVL) shareholders won't be pleased to see that the share price has had a very rough month, dropping 31% and undoing the prior period's positive performance. For any long-term shareholders, the last month ends a year to forget by locking in a 82% share price decline.
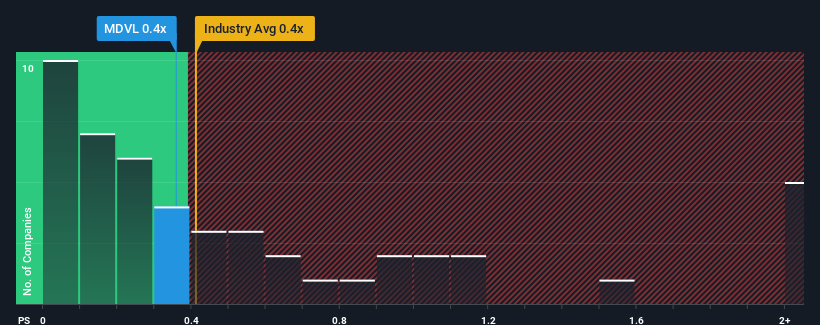
Even after such a large drop in price, it's still not a stretch to say that MedAvail Holdings' price-to-sales (or "P/S") ratio of 0.4x right now seems quite "middle-of-the-road" compared to the Consumer Retailing industry in the United States, seeing as it matches the P/S ratio of the wider industry. While this might not raise any eyebrows, if the P/S ratio is not justified investors could be missing out on a potential opportunity or ignoring looming disappointment.
Check out our latest analysis for MedAvail Holdings
What Does MedAvail Holdings' P/S Mean For Shareholders?
With revenue growth that's exceedingly strong of late, MedAvail Holdings has been doing very well. Perhaps the market is expecting future revenue performance to taper off, which has kept the P/S from rising. If you like the company, you'd be hoping this isn't the case so that you could potentially pick up some stock while it's not quite in favour.
Although there are no analyst estimates available for MedAvail Holdings, take a look at this free data-rich visualisation to see how the company stacks up on earnings, revenue and cash flow.Do Revenue Forecasts Match The P/S Ratio?
MedAvail Holdings' P/S ratio would be typical for a company that's only expected to deliver moderate growth, and importantly, perform in line with the industry.
If we review the last year of revenue growth, the company posted a terrific increase of 212%. The latest three year period has also seen an incredible overall rise in revenue, aided by its incredible short-term performance. Accordingly, shareholders would have been over the moon with those medium-term rates of revenue growth.
Comparing that to the industry, which is only predicted to deliver 4.1% growth in the next 12 months, the company's momentum is stronger based on recent medium-term annualised revenue results.
In light of this, it's curious that MedAvail Holdings' P/S sits in line with the majority of other companies. It may be that most investors are not convinced the company can maintain its recent growth rates.
What Does MedAvail Holdings' P/S Mean For Investors?
With its share price dropping off a cliff, the P/S for MedAvail Holdings looks to be in line with the rest of the Consumer Retailing industry. We'd say the price-to-sales ratio's power isn't primarily as a valuation instrument but rather to gauge current investor sentiment and future expectations.
We didn't quite envision MedAvail Holdings' P/S sitting in line with the wider industry, considering the revenue growth over the last three-year is higher than the current industry outlook. When we see strong revenue with faster-than-industry growth, we can only assume potential risks are what might be placing pressure on the P/S ratio. While recent revenue trends over the past medium-term suggest that the risk of a price decline is low, investors appear to see the likelihood of revenue fluctuations in the future.
We don't want to rain on the parade too much, but we did also find 4 warning signs for MedAvail Holdings (3 can't be ignored!) that you need to be mindful of.
It's important to make sure you look for a great company, not just the first idea you come across. So if growing profitability aligns with your idea of a great company, take a peek at this free list of interesting companies with strong recent earnings growth (and a low P/E).
If you're looking to trade MedAvail Holdings, open an account with the lowest-cost platform trusted by professionals, Interactive Brokers.
With clients in over 200 countries and territories, and access to 160 markets, IBKR lets you trade stocks, options, futures, forex, bonds and funds from a single integrated account.
Enjoy no hidden fees, no account minimums, and FX conversion rates as low as 0.03%, far better than what most brokers offer.
Sponsored ContentNew: Manage All Your Stock Portfolios in One Place
We've created the ultimate portfolio companion for stock investors, and it's free.
• Connect an unlimited number of Portfolios and see your total in one currency
• Be alerted to new Warning Signs or Risks via email or mobile
• Track the Fair Value of your stocks
Have feedback on this article? Concerned about the content? Get in touch with us directly. Alternatively, email editorial-team (at) simplywallst.com.
This article by Simply Wall St is general in nature. We provide commentary based on historical data and analyst forecasts only using an unbiased methodology and our articles are not intended to be financial advice. It does not constitute a recommendation to buy or sell any stock, and does not take account of your objectives, or your financial situation. We aim to bring you long-term focused analysis driven by fundamental data. Note that our analysis may not factor in the latest price-sensitive company announcements or qualitative material. Simply Wall St has no position in any stocks mentioned.
About NasdaqCM:MDVL
MedAvail Holdings
MedAvail Holdings, Inc., a technology-enabled retail pharmacy technology and services company, develops and commercializes self-service pharmacy, mobile application, and kiosk solutions in the United States and Canada.
Mediocre balance sheet and slightly overvalued.
Market Insights

Community Narratives


