Advertisement
- United States
- /
- Consumer Durables
- /
- NYSE:LEN
Is Lennar Still a Good Value After Recent 3.8% Weekly Price Climb?

Simply Wall St
Reviewed by Bailey Pemberton
If you are weighing what to do with Lennar stock right now, you are not alone. There has been plenty for investors to consider, especially with homebuilders making headlines and real estate stocks catching renewed interest. Lennar just closed at $127.14, and while the past year has had its bumps, there have also been flashes of resilience and strong long-term growth. Over the last week, Lennar’s price climbed 3.8%, and it gained 4.3% in the last 30 days. If you zoom out further, the numbers get even more interesting. Lennar is down 18.9% over the past year, but up a robust 82.3% over three years and 104.4% over five years. That paints a picture of long-term momentum despite shorter-term volatility and periods of investor caution.
What has been moving the needle recently? Much relates to shifting expectations about the housing market. There have been positive developments around building activity, and the backdrop of evolving mortgage rates continues to keep big-name builders like Lennar in the spotlight. There is a renewed sense that supply constraints and pent-up demand might give these companies an edge, even if broader market sentiment is uncertain. All of this factors into how the market is valuing Lennar today.
If you look at simple valuation checks, Lennar currently scores a 1 out of 6 on the undervaluation scale, which means it touches fair value in just one key metric. However, digging deeper into what this means, and exploring whether traditional valuation methods really capture the full picture, is where things get interesting. This article breaks down the approaches most investors use, and later, it will explore a potentially better way to understand what Lennar is really worth.
Lennar scores just 1/6 on our valuation checks. See what other red flags we found in the full valuation breakdown.
Approach 1: Lennar Discounted Cash Flow (DCF) Analysis
A Discounted Cash Flow (DCF) model calculates what a company is worth today by projecting its future cash flows and discounting them back to their present value. This approach helps investors understand what Lennar could be worth if it continues generating cash at expected rates.
For Lennar, the latest reported Free Cash Flow (FCF) was a negative $702 Million. Analysts expect a significant turnaround, projecting FCF to reach about $2.15 Billion in 2026. Over the next 10 years, projections extrapolated beyond analyst estimates show FCF gradually decreasing from $2.15 Billion in 2026 to around $1.35 Billion by 2035, with a series of step-downs over the decade.
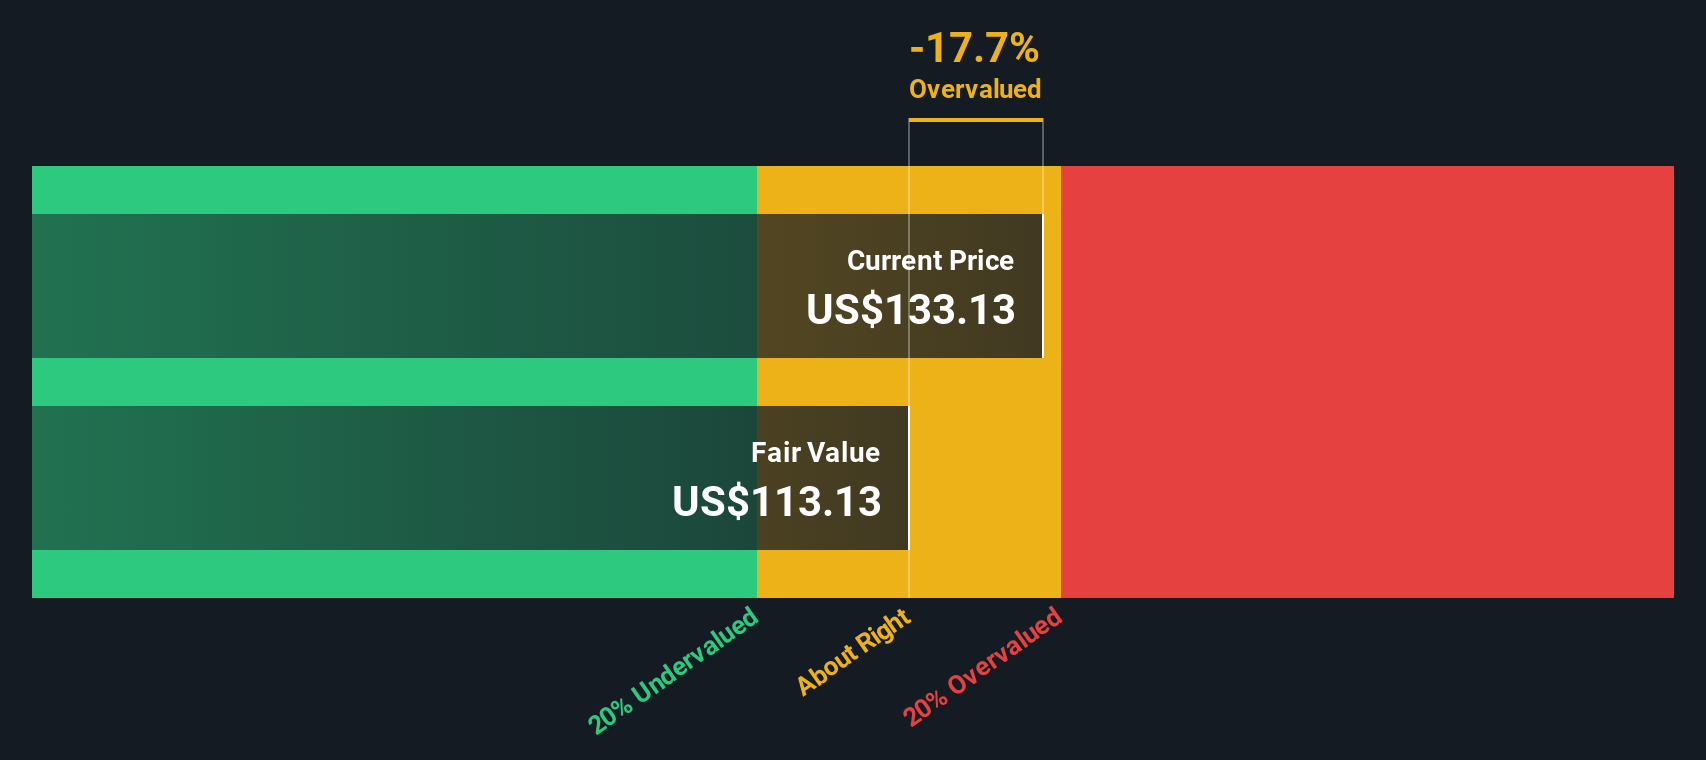
Using this two-stage Free Cash Flow to Equity model, the estimated intrinsic value per Lennar share is $81.66. Compared to the recent closing price of $127.14, this signals a substantial disparity.
Currently, the DCF model suggests Lennar is 55.7% overvalued, with its share price well above the calculated fair value. While projecting cash flows can never give perfect answers, this approach currently implies caution for would-be buyers at today’s price.
Result: OVERVALUED
Our Discounted Cash Flow (DCF) analysis suggests Lennar may be overvalued by 55.7%. Find undervalued stocks or create your own screener to find better value opportunities.
Approach 2: Lennar Price vs Earnings
Price-to-Earnings (PE) is a widely used valuation metric for profitable companies like Lennar. It tells investors how much they are paying for each dollar of earnings and serves as a quick way to gauge whether a stock is cheap or expensive relative to its earnings power. Because Lennar consistently posts profits, the PE ratio is a natural and useful lens through which to view the stock's value.
It's important to note that what counts as a "normal" or "fair" PE ratio is not set in stone. It is shaped by expectations for future growth and the risks facing the business. Companies with higher expected earnings growth or lower risk often trade at higher PE ratios, while slower-growing or riskier stocks command lower multiples.
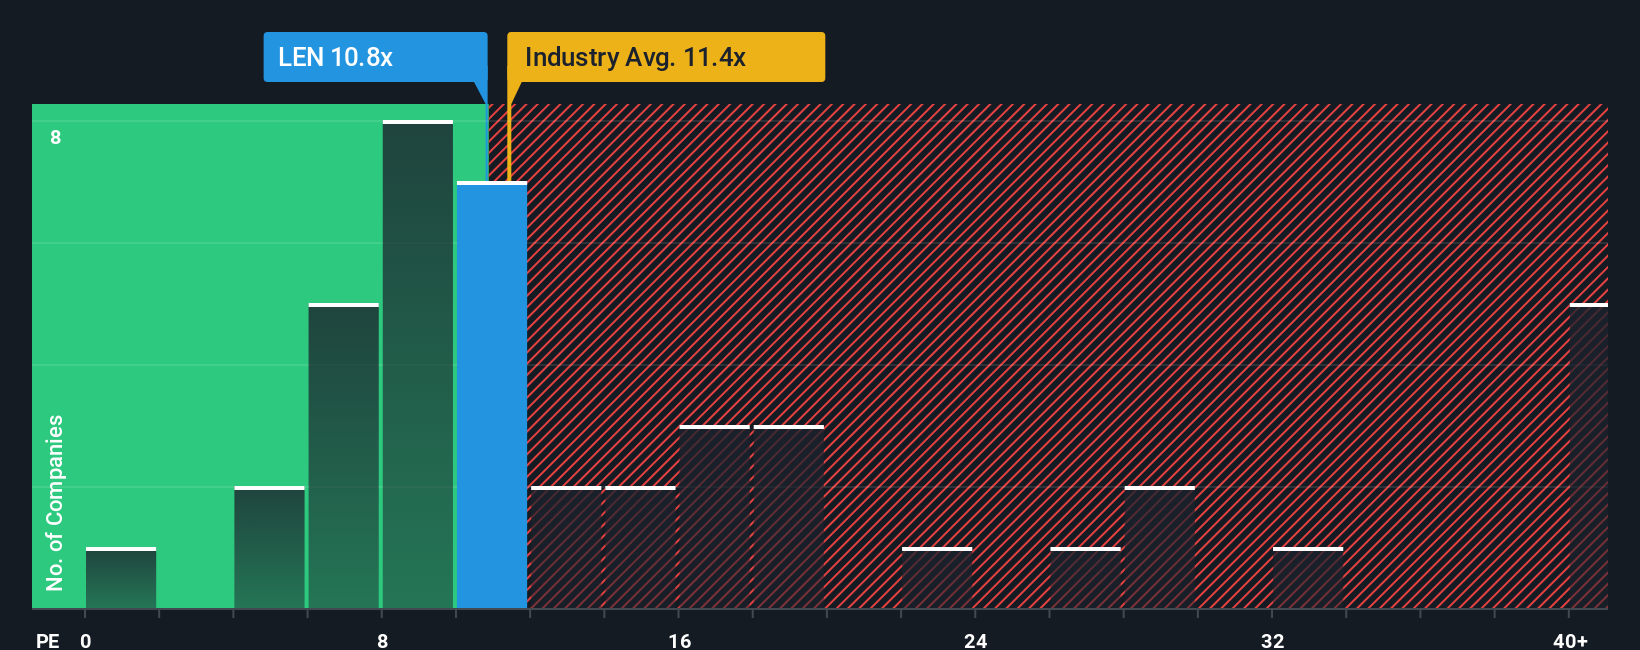
Right now, Lennar trades at a PE of 12.2x. That is slightly above the Consumer Durables industry average of 10.4x, and just above the peer average of 11.3x. However, benchmarks only tell part of the story. Simply Wall St’s “Fair Ratio” puts Lennar’s ideal PE near 16.8x, factoring in elements like its outlook, margins, industry dynamics, and specific risk profile. Unlike simple industry or peer comparisons, the Fair Ratio tries to tailor expectations to the company’s actual mix of strengths and challenges, providing a more nuanced view.
Compared to this Fair Ratio, Lennar’s current PE of 12.2x suggests the stock is undervalued, as investors are paying well below what you would reasonably expect given its fundamentals.
Result: UNDERVALUED
PE ratios tell one story, but what if the real opportunity lies elsewhere? Discover companies where insiders are betting big on explosive growth.
Upgrade Your Decision Making: Choose your Lennar Narrative
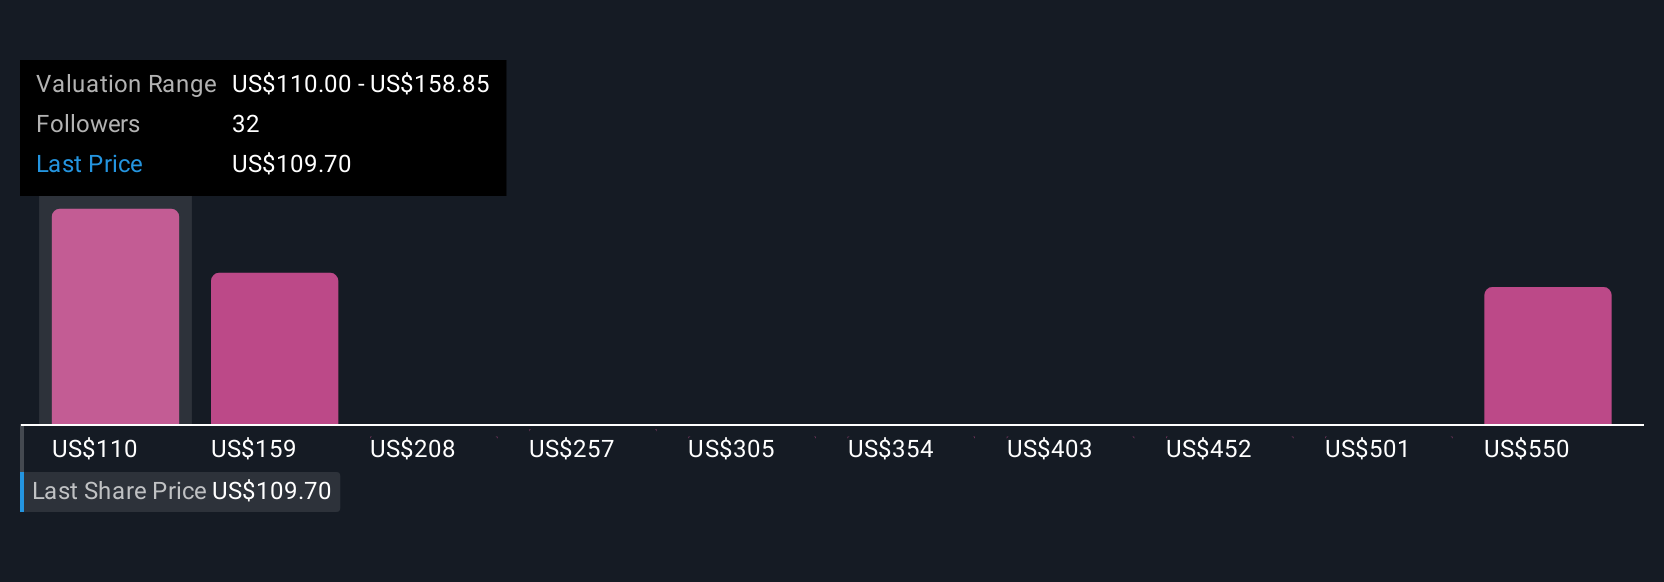
Earlier we mentioned that there is an even better way to understand valuation, so let’s introduce you to Narratives. A Narrative is a powerful yet approachable tool that allows investors to tie their unique view of Lennar’s story to a numeric forecast, connecting assumptions about future revenue, earnings, and margins directly to a calculated fair value. Narratives make investing more personal and data-driven by letting you describe what you believe will happen, project how the business will perform, and then see the resulting fair value all in one place. Available right now within the Simply Wall St Community page and used by millions, Narratives help you decide when to buy or sell by tracking how your chosen Fair Value compares to the live share price. Best of all, Narratives update automatically as new information comes in, such as earnings releases or big news headlines, so your perspective always stays relevant. For example, some investors currently see Lennar’s fair value as high as $162.49, anticipating strong growth despite near-term headwinds, while others value it as low as $95.00 based on concerns about shrinking profit margins and market risk.
Do you think there's more to the story for Lennar? Create your own Narrative to let the Community know!
This article by Simply Wall St is general in nature. We provide commentary based on historical data and analyst forecasts only using an unbiased methodology and our articles are not intended to be financial advice. It does not constitute a recommendation to buy or sell any stock, and does not take account of your objectives, or your financial situation. We aim to bring you long-term focused analysis driven by fundamental data. Note that our analysis may not factor in the latest price-sensitive company announcements or qualitative material. Simply Wall St has no position in any stocks mentioned.
New: AI Stock Screener & Alerts
Our new AI Stock Screener scans the market every day to uncover opportunities.
• Dividend Powerhouses (3%+ Yield)
• Undervalued Small Caps with Insider Buying
• High growth Tech and AI Companies
Or build your own from over 50 metrics.
Have feedback on this article? Concerned about the content? Get in touch with us directly. Alternatively, email editorial-team@simplywallst.com
About NYSE:LEN
Lennar
Operates as a homebuilder primarily under the Lennar brand in the United States.
Excellent balance sheet average dividend payer.
Similar Companies
Market Insights

Advertisement
Community Narratives
Finding The True Value Of A Logistics Powerhouse
Fair Value US$95.21|8.5% undervalued
NV
Community Contributor
Paradigm Biopharmaceuticals Will Lead Osteoarthritis Treatment with Zilosul's FDA Success
Fair Value AU$5.50|91.9% undervalued
AM
Community Contributor
Barrick Mining (ABX:CA): A Gold Hedge against a U.S. Shutdown
Fair Value CA$60.00|26.5% undervalued
GM
Community Contributor