
Advertisement
Finding a business that has the potential to grow substantially is not easy, but it is possible if we look at a few key financial metrics. In a perfect world, we'd like to see a company investing more capital into its business and ideally the returns earned from that capital are also increasing. Basically this means that a company has profitable initiatives that it can continue to reinvest in, which is a trait of a compounding machine. Having said that, from a first glance at Leggett & Platt (NYSE:LEG) we aren't jumping out of our chairs at how returns are trending, but let's have a deeper look.
Return On Capital Employed (ROCE): What Is It?
For those that aren't sure what ROCE is, it measures the amount of pre-tax profits a company can generate from the capital employed in its business. The formula for this calculation on Leggett & Platt is:
Return on Capital Employed = Earnings Before Interest and Tax (EBIT) ÷ (Total Assets - Current Liabilities)
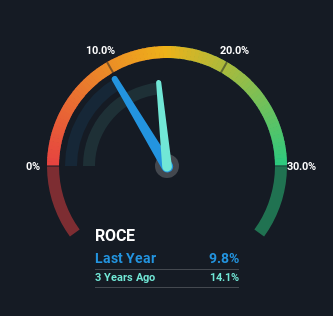
0.098 = US$263m ÷ (US$3.8b - US$1.2b) (Based on the trailing twelve months to June 2024).
Therefore, Leggett & Platt has an ROCE of 9.8%. In absolute terms, that's a low return and it also under-performs the Consumer Durables industry average of 14%.
Check out our latest analysis for Leggett & Platt
In the above chart we have measured Leggett & Platt's prior ROCE against its prior performance, but the future is arguably more important. If you're interested, you can view the analysts predictions in our free analyst report for Leggett & Platt .
What Can We Tell From Leggett & Platt's ROCE Trend?
We've noticed that although returns on capital are flat over the last five years, the amount of capital employed in the business has fallen 35% in that same period. To us that doesn't look like a multi-bagger because the company appears to be selling assets and it's returns aren't increasing. Not only that, but the low returns on this capital mentioned earlier would leave most investors unimpressed.
On another note, while the change in ROCE trend might not scream for attention, it's interesting that the current liabilities have actually gone up over the last five years. This is intriguing because if current liabilities hadn't increased to 30% of total assets, this reported ROCE would probably be less than9.8% because total capital employed would be higher.The 9.8% ROCE could be even lower if current liabilities weren't 30% of total assets, because the the formula would show a larger base of total capital employed. With that in mind, just be wary if this ratio increases in the future, because if it gets particularly high, this brings with it some new elements of risk.
In Conclusion...
Overall, we're not ecstatic to see Leggett & Platt reducing the amount of capital it employs in the business. Since the stock has declined 57% over the last five years, investors may not be too optimistic on this trend improving either. On the whole, we aren't too inspired by the underlying trends and we think there may be better chances of finding a multi-bagger elsewhere.
If you'd like to know more about Leggett & Platt, we've spotted 2 warning signs, and 1 of them can't be ignored.
For those who like to invest in solid companies, check out this free list of companies with solid balance sheets and high returns on equity.
New: AI Stock Screener & Alerts
Our new AI Stock Screener scans the market every day to uncover opportunities.
• Dividend Powerhouses (3%+ Yield)
• Undervalued Small Caps with Insider Buying
• High growth Tech and AI Companies
Or build your own from over 50 metrics.
Have feedback on this article? Concerned about the content? Get in touch with us directly. Alternatively, email editorial-team (at) simplywallst.com.
This article by Simply Wall St is general in nature. We provide commentary based on historical data and analyst forecasts only using an unbiased methodology and our articles are not intended to be financial advice. It does not constitute a recommendation to buy or sell any stock, and does not take account of your objectives, or your financial situation. We aim to bring you long-term focused analysis driven by fundamental data. Note that our analysis may not factor in the latest price-sensitive company announcements or qualitative material. Simply Wall St has no position in any stocks mentioned.
About NYSE:LEG
Leggett & Platt
Designs, manufactures, and sells engineered components and products in the United States, Europe, China, Canada, Mexico, and internationally.
Slight risk and fair value.
Similar Companies
Market Insights

Advertisement
Weekly Picks
WO

woodworthfund on MGP Ingredients ·
THE KINGDOM OF BROWN GOODS: WHY MGPI IS BEING CRUSHED BY INVENTORY & PRIMED FOR RESURRECTION
Fair Value:US$4034.1% undervalued
16 followersusers have followed this narrative
1 commentusers have commented on this narrative
4 likesusers have liked this narrative
DO


Double_Bubbler on Vertical Aerospace ·
Why Vertical Aerospace (NYSE: EVTL) is Worth Possibly Over 13x its Current Price
Fair Value:US$6090.0% undervalued
21 followersusers have followed this narrative
1 commentusers have commented on this narrative
17 likesusers have liked this narrative
TI


TickerTickle on Oracle ·
The Quiet Giant That Became AI’s Power Grid
Fair Value:US$389.8142.8% undervalued
32 followersusers have followed this narrative
3 commentsusers have commented on this narrative
8 likesusers have liked this narrative
Recently Updated Narratives
MA


MarkoVT on ANYCOLOR ·
Near zero debt, Japan centric focus provides future growth
Fair Value:JP¥7.11k18.9% undervalued
1 followerusers have followed this narrative
0 commentsusers have commented on this narrative
0 likesusers have liked this narrative
LE

lexdrew1 on Corning ·
Corning's Revenue Will Climb by 12.73% in Just Five Years
Fair Value:US$108.6313.3% undervalued
1 followerusers have followed this narrative
0 commentsusers have commented on this narrative
0 likesusers have liked this narrative
LE

lexdrew1 on GE Vernova ·
GE Vernova revenue will grow by 13% with a future PE of 64.7x
Fair Value:US$824.5712.3% undervalued
8 followersusers have followed this narrative
0 commentsusers have commented on this narrative
0 likesusers have liked this narrative
Popular Narratives
TH


TheWallstreetKing on MicroVision ·
MicroVision will explode future revenue by 380.37% with a vision towards success
Fair Value:US$6098.5% undervalued
119 followersusers have followed this narrative
11 commentsusers have commented on this narrative
22 likesusers have liked this narrative
AN


AnalystConsensusTarget on NVIDIA ·
NVDA: Expanding AI Demand Will Drive Major Data Center Investments Through 2026
Fair Value:US$250.3926.6% undervalued
963 followersusers have followed this narrative
6 commentsusers have commented on this narrative
25 likesusers have liked this narrative
RO


RockeTeller on Santacruz Silver Mining ·
Crazy Undervalued 42 Baggers Silver Play (Active & Running Mine)
Fair Value:CA$8688.6% undervalued
76 followersusers have followed this narrative
8 commentsusers have commented on this narrative
21 likesusers have liked this narrative
