- United States
- /
- Consumer Durables
- /
- NasdaqGM:UHG
United Homes Group (NASDAQ:UHG) Will Be Hoping To Turn Its Returns On Capital Around


What financial metrics can indicate to us that a company is maturing or even in decline? Businesses in decline often have two underlying trends, firstly, a declining return on capital employed (ROCE) and a declining base of capital employed. This indicates the company is producing less profit from its investments and its total assets are decreasing. Having said that, after a brief look, United Homes Group (NASDAQ:UHG) we aren't filled with optimism, but let's investigate further.
What Is Return On Capital Employed (ROCE)?
Just to clarify if you're unsure, ROCE is a metric for evaluating how much pre-tax income (in percentage terms) a company earns on the capital invested in its business. The formula for this calculation on United Homes Group is:
Return on Capital Employed = Earnings Before Interest and Tax (EBIT) ÷ (Total Assets - Current Liabilities)
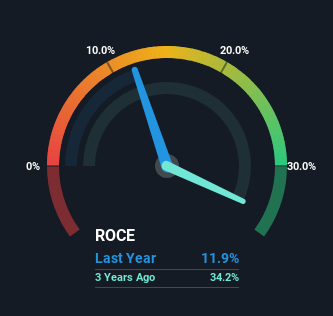
0.12 = US$15m ÷ (US$299m - US$176m) (Based on the trailing twelve months to December 2023).
Therefore, United Homes Group has an ROCE of 12%. In absolute terms, that's a pretty normal return, and it's somewhat close to the Consumer Durables industry average of 14%.
View our latest analysis for United Homes Group
While the past is not representative of the future, it can be helpful to know how a company has performed historically, which is why we have this chart above. If you'd like to look at how United Homes Group has performed in the past in other metrics, you can view this free graph of United Homes Group's past earnings, revenue and cash flow.
What Can We Tell From United Homes Group's ROCE Trend?
In terms of United Homes Group's historical ROCE movements, the trend doesn't inspire confidence. To be more specific, the ROCE was 34% three years ago, but since then it has dropped noticeably. Meanwhile, capital employed in the business has stayed roughly the flat over the period. Companies that exhibit these attributes tend to not be shrinking, but they can be mature and facing pressure on their margins from competition. If these trends continue, we wouldn't expect United Homes Group to turn into a multi-bagger.
On a side note, United Homes Group's current liabilities have increased over the last three years to 59% of total assets, effectively distorting the ROCE to some degree. Without this increase, it's likely that ROCE would be even lower than 12%. What this means is that in reality, a rather large portion of the business is being funded by the likes of the company's suppliers or short-term creditors, which can bring some risks of its own.
The Bottom Line On United Homes Group's ROCE
All in all, the lower returns from the same amount of capital employed aren't exactly signs of a compounding machine. Investors haven't taken kindly to these developments, since the stock has declined 39% from where it was three years ago. With underlying trends that aren't great in these areas, we'd consider looking elsewhere.
One more thing to note, we've identified 3 warning signs with United Homes Group and understanding these should be part of your investment process.
While United Homes Group may not currently earn the highest returns, we've compiled a list of companies that currently earn more than 25% return on equity. Check out this free list here.
If you're looking to trade United Homes Group, open an account with the lowest-cost platform trusted by professionals, Interactive Brokers.
With clients in over 200 countries and territories, and access to 160 markets, IBKR lets you trade stocks, options, futures, forex, bonds and funds from a single integrated account.
Enjoy no hidden fees, no account minimums, and FX conversion rates as low as 0.03%, far better than what most brokers offer.
Sponsored ContentNew: AI Stock Screener & Alerts
Our new AI Stock Screener scans the market every day to uncover opportunities.
• Dividend Powerhouses (3%+ Yield)
• Undervalued Small Caps with Insider Buying
• High growth Tech and AI Companies
Or build your own from over 50 metrics.
Have feedback on this article? Concerned about the content? Get in touch with us directly. Alternatively, email editorial-team (at) simplywallst.com.
This article by Simply Wall St is general in nature. We provide commentary based on historical data and analyst forecasts only using an unbiased methodology and our articles are not intended to be financial advice. It does not constitute a recommendation to buy or sell any stock, and does not take account of your objectives, or your financial situation. We aim to bring you long-term focused analysis driven by fundamental data. Note that our analysis may not factor in the latest price-sensitive company announcements or qualitative material. Simply Wall St has no position in any stocks mentioned.
About NasdaqGM:UHG
United Homes Group
A homebuilding company, engages in the design, building, and sale of homes in South Carolina, North Carolina, and Georgia.
Slight and slightly overvalued.
Market Insights

Community Narratives


