
Advertisement
- United States
- /
- Leisure
- /
- NasdaqGS:SWBI
Is Smith & Wesson Brands, Inc.'s (NASDAQ:SWBI) Recent Price Movement Underpinned By Its Weak Fundamentals?

Smith & Wesson Brands (NASDAQ:SWBI) has had a rough three months with its share price down 19%. It is possible that the markets have ignored the company's differing financials and decided to lean-in to the negative sentiment. Long-term fundamentals are usually what drive market outcomes, so it's worth paying close attention. In this article, we decided to focus on Smith & Wesson Brands' ROE.
Return on Equity or ROE is a test of how effectively a company is growing its value and managing investors’ money. In short, ROE shows the profit each dollar generates with respect to its shareholder investments.
View our latest analysis for Smith & Wesson Brands
How Do You Calculate Return On Equity?
Return on equity can be calculated by using the formula:
Return on Equity = Net Profit (from continuing operations) ÷ Shareholders' Equity
So, based on the above formula, the ROE for Smith & Wesson Brands is:
9.9% = US$40m ÷ US$398m (Based on the trailing twelve months to April 2024).
The 'return' is the amount earned after tax over the last twelve months. So, this means that for every $1 of its shareholder's investments, the company generates a profit of $0.10.
What Is The Relationship Between ROE And Earnings Growth?
So far, we've learned that ROE is a measure of a company's profitability. Depending on how much of these profits the company reinvests or "retains", and how effectively it does so, we are then able to assess a company’s earnings growth potential. Assuming all else is equal, companies that have both a higher return on equity and higher profit retention are usually the ones that have a higher growth rate when compared to companies that don't have the same features.
Smith & Wesson Brands' Earnings Growth And 9.9% ROE
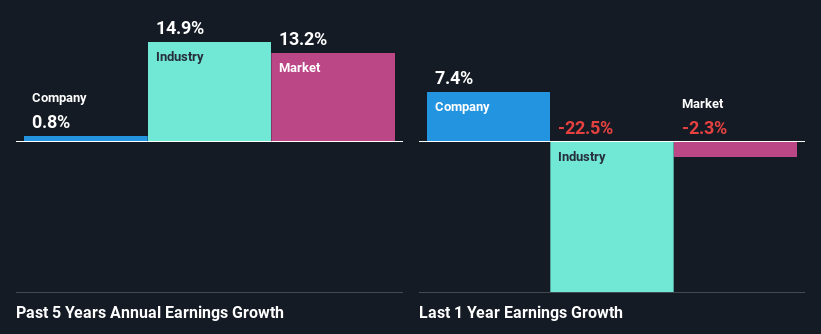
On the face of it, Smith & Wesson Brands' ROE is not much to talk about. Next, when compared to the average industry ROE of 15%, the company's ROE leaves us feeling even less enthusiastic. Hence, the flat earnings seen by Smith & Wesson Brands over the past five years could probably be the result of it having a lower ROE.
Next, on comparing with the industry net income growth, we found that Smith & Wesson Brands' reported growth was lower than the industry growth of 15% over the last few years, which is not something we like to see.
Earnings growth is a huge factor in stock valuation. It’s important for an investor to know whether the market has priced in the company's expected earnings growth (or decline). By doing so, they will have an idea if the stock is headed into clear blue waters or if swampy waters await. Is SWBI fairly valued? This infographic on the company's intrinsic value has everything you need to know.
Is Smith & Wesson Brands Making Efficient Use Of Its Profits?
Smith & Wesson Brands' low three-year median payout ratio of 17% (implying that the company keeps83% of its income) should mean that the company is retaining most of its earnings to fuel its growth and this should be reflected in its growth number, but that's not the case.
Additionally, Smith & Wesson Brands has paid dividends over a period of four years, which means that the company's management is determined to pay dividends even if it means little to no earnings growth.
Conclusion
Overall, we have mixed feelings about Smith & Wesson Brands. While the company does have a high rate of profit retention, its low rate of return is probably hampering its earnings growth. So far, we've only made a quick discussion around the company's earnings growth. So it may be worth checking this free detailed graph of Smith & Wesson Brands' past earnings, as well as revenue and cash flows to get a deeper insight into the company's performance.
New: Manage All Your Stock Portfolios in One Place
We've created the ultimate portfolio companion for stock investors, and it's free.
• Connect an unlimited number of Portfolios and see your total in one currency
• Be alerted to new Warning Signs or Risks via email or mobile
• Track the Fair Value of your stocks
Have feedback on this article? Concerned about the content? Get in touch with us directly. Alternatively, email editorial-team (at) simplywallst.com.
This article by Simply Wall St is general in nature. We provide commentary based on historical data and analyst forecasts only using an unbiased methodology and our articles are not intended to be financial advice. It does not constitute a recommendation to buy or sell any stock, and does not take account of your objectives, or your financial situation. We aim to bring you long-term focused analysis driven by fundamental data. Note that our analysis may not factor in the latest price-sensitive company announcements or qualitative material. Simply Wall St has no position in any stocks mentioned.
Have feedback on this article? Concerned about the content? Get in touch with us directly. Alternatively, email editorial-team@simplywallst.com
About NasdaqGS:SWBI
Smith & Wesson Brands
Designs, manufactures, and sells firearms worldwide.
Undervalued with excellent balance sheet.
Similar Companies
Market Insights

Advertisement
Community Narratives
Pinterest will surge as advertising innovations ignite revenue growth
Fair Value US$42.63|26.3% undervalued
BR
Community Contributor
Brambles' Revenue Set to Climb 14% with Profit Margins Following
Fair Value AU$21.90|4.9% overvalued
RO
Community Contributor
Challenging Future for STG as Organic Sales Decline by 8.8%
Fair Value DKK 116.13|26.8% undervalued
KA
Community Contributor