
Advertisement
- United States
- /
- Consumer Durables
- /
- NasdaqGM:STRR
Is Star Equity Holdings (NASDAQ:STRR) A Risky Investment?

David Iben put it well when he said, 'Volatility is not a risk we care about. What we care about is avoiding the permanent loss of capital.' It's only natural to consider a company's balance sheet when you examine how risky it is, since debt is often involved when a business collapses. As with many other companies Star Equity Holdings, Inc. (NASDAQ:STRR) makes use of debt. But should shareholders be worried about its use of debt?
Why Does Debt Bring Risk?
Debt is a tool to help businesses grow, but if a business is incapable of paying off its lenders, then it exists at their mercy. Part and parcel of capitalism is the process of 'creative destruction' where failed businesses are mercilessly liquidated by their bankers. However, a more common (but still painful) scenario is that it has to raise new equity capital at a low price, thus permanently diluting shareholders. Of course, plenty of companies use debt to fund growth, without any negative consequences. The first thing to do when considering how much debt a business uses is to look at its cash and debt together.
Check out our latest analysis for Star Equity Holdings
What Is Star Equity Holdings's Net Debt?
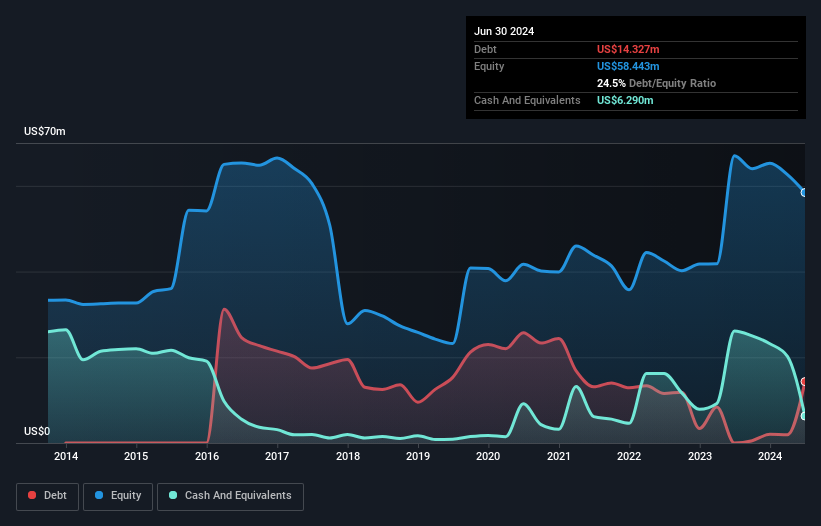
The image below, which you can click on for greater detail, shows that at June 2024 Star Equity Holdings had debt of US$14.3m, up from none in one year. On the flip side, it has US$6.29m in cash leading to net debt of about US$8.04m.
How Strong Is Star Equity Holdings' Balance Sheet?
Zooming in on the latest balance sheet data, we can see that Star Equity Holdings had liabilities of US$13.0m due within 12 months and liabilities of US$9.47m due beyond that. Offsetting these obligations, it had cash of US$6.29m as well as receivables valued at US$6.61m due within 12 months. So its liabilities total US$9.52m more than the combination of its cash and short-term receivables.
This deficit is considerable relative to its market capitalization of US$13.7m, so it does suggest shareholders should keep an eye on Star Equity Holdings' use of debt. Should its lenders demand that it shore up the balance sheet, shareholders would likely face severe dilution. When analysing debt levels, the balance sheet is the obvious place to start. But ultimately the future profitability of the business will decide if Star Equity Holdings can strengthen its balance sheet over time. So if you're focused on the future you can check out this free report showing analyst profit forecasts.
Over 12 months, Star Equity Holdings made a loss at the EBIT level, and saw its revenue drop to US$47m, which is a fall of 5.6%. We would much prefer see growth.
Caveat Emptor
Importantly, Star Equity Holdings had an earnings before interest and tax (EBIT) loss over the last year. Indeed, it lost a very considerable US$9.1m at the EBIT level. When we look at that and recall the liabilities on its balance sheet, relative to cash, it seems unwise to us for the company to have any debt. Quite frankly we think the balance sheet is far from match-fit, although it could be improved with time. However, it doesn't help that it burned through US$4.2m of cash over the last year. So suffice it to say we consider the stock very risky. The balance sheet is clearly the area to focus on when you are analysing debt. But ultimately, every company can contain risks that exist outside of the balance sheet. To that end, you should learn about the 4 warning signs we've spotted with Star Equity Holdings (including 1 which makes us a bit uncomfortable) .
When all is said and done, sometimes its easier to focus on companies that don't even need debt. Readers can access a list of growth stocks with zero net debt 100% free, right now.
New: Manage All Your Stock Portfolios in One Place
We've created the ultimate portfolio companion for stock investors, and it's free.
• Connect an unlimited number of Portfolios and see your total in one currency
• Be alerted to new Warning Signs or Risks via email or mobile
• Track the Fair Value of your stocks
Have feedback on this article? Concerned about the content? Get in touch with us directly. Alternatively, email editorial-team (at) simplywallst.com.
This article by Simply Wall St is general in nature. We provide commentary based on historical data and analyst forecasts only using an unbiased methodology and our articles are not intended to be financial advice. It does not constitute a recommendation to buy or sell any stock, and does not take account of your objectives, or your financial situation. We aim to bring you long-term focused analysis driven by fundamental data. Note that our analysis may not factor in the latest price-sensitive company announcements or qualitative material. Simply Wall St has no position in any stocks mentioned.
About NasdaqGM:STRR
Star Equity Holdings
A diversified holding company, engages in the construction business in the United States.
Good value with adequate balance sheet.
Similar Companies
Market Insights

Advertisement
Community Narratives
Pinterest will surge as advertising innovations ignite revenue growth
Fair Value US$42.63|27.1% undervalued
BR
Community Contributor
Brambles' Revenue Set to Climb 14% with Profit Margins Following
Fair Value AU$21.90|4.9% overvalued
RO
Community Contributor
Challenging Future for STG as Organic Sales Decline by 8.8%
Fair Value DKK 116.13|26.8% undervalued
KA
Community Contributor