
Advertisement
- United States
- /
- Luxury
- /
- NasdaqGM:SGC
What You Can Learn From Superior Group of Companies, Inc.'s (NASDAQ:SGC) P/S After Its 36% Share Price Crash
The Superior Group of Companies, Inc. (NASDAQ:SGC) share price has fared very poorly over the last month, falling by a substantial 36%. Looking at the bigger picture, even after this poor month the stock is up 45% in the last year.
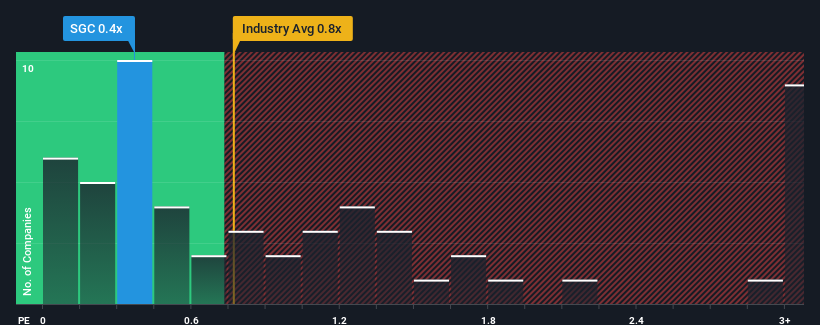
In spite of the heavy fall in price, it's still not a stretch to say that Superior Group of Companies' price-to-sales (or "P/S") ratio of 0.4x right now seems quite "middle-of-the-road" compared to the Luxury industry in the United States, where the median P/S ratio is around 0.8x. Although, it's not wise to simply ignore the P/S without explanation as investors may be disregarding a distinct opportunity or a costly mistake.
Check out our latest analysis for Superior Group of Companies
How Has Superior Group of Companies Performed Recently?
With revenue growth that's inferior to most other companies of late, Superior Group of Companies has been relatively sluggish. It might be that many expect the uninspiring revenue performance to strengthen positively, which has kept the P/S ratio from falling. However, if this isn't the case, investors might get caught out paying too much for the stock.
Want the full picture on analyst estimates for the company? Then our free report on Superior Group of Companies will help you uncover what's on the horizon.Do Revenue Forecasts Match The P/S Ratio?
In order to justify its P/S ratio, Superior Group of Companies would need to produce growth that's similar to the industry.
If we review the last year of revenue, the company posted a result that saw barely any deviation from a year ago. That's essentially a continuation of what we've seen over the last three years, as its revenue growth has been virtually non-existent for that entire period. So it seems apparent to us that the company has struggled to grow revenue meaningfully over that time.
Looking ahead now, revenue is anticipated to climb by 4.5% per year during the coming three years according to the three analysts following the company. That's shaping up to be similar to the 6.2% per year growth forecast for the broader industry.
With this information, we can see why Superior Group of Companies is trading at a fairly similar P/S to the industry. Apparently shareholders are comfortable to simply hold on while the company is keeping a low profile.
What We Can Learn From Superior Group of Companies' P/S?
With its share price dropping off a cliff, the P/S for Superior Group of Companies looks to be in line with the rest of the Luxury industry. Using the price-to-sales ratio alone to determine if you should sell your stock isn't sensible, however it can be a practical guide to the company's future prospects.
Our look at Superior Group of Companies' revenue growth estimates show that its P/S is about what we expect, as both metrics follow closely with the industry averages. At this stage investors feel the potential for an improvement or deterioration in revenue isn't great enough to push P/S in a higher or lower direction. Unless these conditions change, they will continue to support the share price at these levels.
There are also other vital risk factors to consider before investing and we've discovered 2 warning signs for Superior Group of Companies that you should be aware of.
If these risks are making you reconsider your opinion on Superior Group of Companies, explore our interactive list of high quality stocks to get an idea of what else is out there.
New: Manage All Your Stock Portfolios in One Place
We've created the ultimate portfolio companion for stock investors, and it's free.
• Connect an unlimited number of Portfolios and see your total in one currency
• Be alerted to new Warning Signs or Risks via email or mobile
• Track the Fair Value of your stocks
Have feedback on this article? Concerned about the content? Get in touch with us directly. Alternatively, email editorial-team (at) simplywallst.com.
This article by Simply Wall St is general in nature. We provide commentary based on historical data and analyst forecasts only using an unbiased methodology and our articles are not intended to be financial advice. It does not constitute a recommendation to buy or sell any stock, and does not take account of your objectives, or your financial situation. We aim to bring you long-term focused analysis driven by fundamental data. Note that our analysis may not factor in the latest price-sensitive company announcements or qualitative material. Simply Wall St has no position in any stocks mentioned.
About NasdaqGM:SGC
Superior Group of Companies
Manufactures and sells apparel and accessories in the United States and internationally.
Average dividend payer and fair value.
Similar Companies
Market Insights

Advertisement
Community Narratives
America Wants Homegrown Drones — Draganfly Is Ready to Deliver
Fair Value US$9.21|32.6% undervalued
JO
Community Contributor
Cheesecake Factory offers an enticing opportunity for long-term growth by leveraging new concepts
Fair Value US$73.83|25.6% undervalued
ZW
Community Contributor
Coca-Cola’s Intrinsic Value Set to Rise with Fed Rate Cut
Fair Value US$67.50|1.6% undervalued
AL
Community Contributor
Fully Permitted Gold Mine with 50 Baggers Potential 
Fair Value CA$41.00|98.2% undervalued
RO
Community Contributor