
Advertisement
- United States
- /
- Leisure
- /
- NasdaqGS:PTON
Positive Sentiment Still Eludes Peloton Interactive, Inc. (NASDAQ:PTON) Following 31% Share Price Slump
Unfortunately for some shareholders, the Peloton Interactive, Inc. (NASDAQ:PTON) share price has dived 31% in the last thirty days, prolonging recent pain. The recent drop completes a disastrous twelve months for shareholders, who are sitting on a 68% loss during that time.
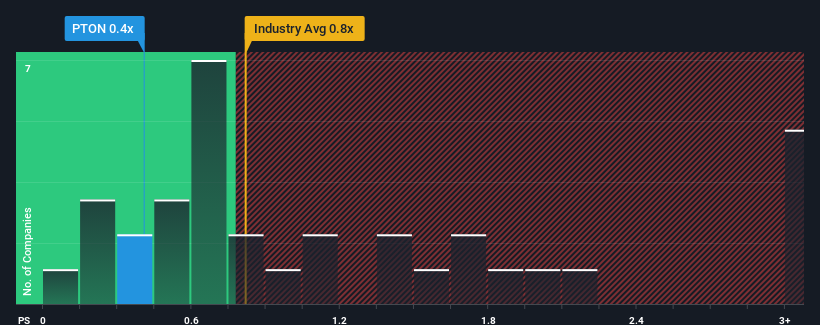
In spite of the heavy fall in price, it's still not a stretch to say that Peloton Interactive's price-to-sales (or "P/S") ratio of 0.4x right now seems quite "middle-of-the-road" compared to the Leisure industry in the United States, where the median P/S ratio is around 0.8x. However, investors might be overlooking a clear opportunity or potential setback if there is no rational basis for the P/S.
See our latest analysis for Peloton Interactive
How Has Peloton Interactive Performed Recently?
With revenue that's retreating more than the industry's average of late, Peloton Interactive has been very sluggish. Perhaps the market is expecting future revenue performance to begin matching the rest of the industry, which has kept the P/S from declining. You'd much rather the company improve its revenue if you still believe in the business. If not, then existing shareholders may be a little nervous about the viability of the share price.
Want the full picture on analyst estimates for the company? Then our free report on Peloton Interactive will help you uncover what's on the horizon.What Are Revenue Growth Metrics Telling Us About The P/S?
Peloton Interactive's P/S ratio would be typical for a company that's only expected to deliver moderate growth, and importantly, perform in line with the industry.
In reviewing the last year of financials, we were disheartened to see the company's revenues fell to the tune of 11%. This means it has also seen a slide in revenue over the longer-term as revenue is down 7.6% in total over the last three years. So unfortunately, we have to acknowledge that the company has not done a great job of growing revenue over that time.
Shifting to the future, estimates from the analysts covering the company suggest revenue should grow by 4.3% per annum over the next three years. That's shaping up to be materially higher than the 1.4% per year growth forecast for the broader industry.
With this information, we find it interesting that Peloton Interactive is trading at a fairly similar P/S compared to the industry. It may be that most investors aren't convinced the company can achieve future growth expectations.
What Does Peloton Interactive's P/S Mean For Investors?
Peloton Interactive's plummeting stock price has brought its P/S back to a similar region as the rest of the industry. Generally, our preference is to limit the use of the price-to-sales ratio to establishing what the market thinks about the overall health of a company.
Despite enticing revenue growth figures that outpace the industry, Peloton Interactive's P/S isn't quite what we'd expect. When we see a strong revenue outlook, with growth outpacing the industry, we can only assume potential uncertainty around these figures are what might be placing slight pressure on the P/S ratio. However, if you agree with the analysts' forecasts, you may be able to pick up the stock at an attractive price.
Plus, you should also learn about these 4 warning signs we've spotted with Peloton Interactive (including 1 which shouldn't be ignored).
Of course, profitable companies with a history of great earnings growth are generally safer bets. So you may wish to see this free collection of other companies that have reasonable P/E ratios and have grown earnings strongly.
New: Manage All Your Stock Portfolios in One Place
We've created the ultimate portfolio companion for stock investors, and it's free.
• Connect an unlimited number of Portfolios and see your total in one currency
• Be alerted to new Warning Signs or Risks via email or mobile
• Track the Fair Value of your stocks
Have feedback on this article? Concerned about the content? Get in touch with us directly. Alternatively, email editorial-team (at) simplywallst.com.
This article by Simply Wall St is general in nature. We provide commentary based on historical data and analyst forecasts only using an unbiased methodology and our articles are not intended to be financial advice. It does not constitute a recommendation to buy or sell any stock, and does not take account of your objectives, or your financial situation. We aim to bring you long-term focused analysis driven by fundamental data. Note that our analysis may not factor in the latest price-sensitive company announcements or qualitative material. Simply Wall St has no position in any stocks mentioned.
About NasdaqGS:PTON
Peloton Interactive
Provides fitness and wellness products and services in North America and internationally.
Reasonable growth potential and slightly overvalued.
Similar Companies
Market Insights

Advertisement
Community Narratives
A formidable player in AI and enterprise computing.
Fair Value US$210.00|12.2% overvalued
CO
Community Contributor
IREN's Bold Moves in Sustainable Bitcoin Mining & AI Data Centers
Fair Value US$72.52|17.1% undervalued
BL
Community Contributor
Cooling the Champions: The Aussie Tech Behind F1's Victories
Fair Value AU$12.40|38.7% undervalued
TR
Community Contributor