- United States
- /
- Luxury
- /
- NasdaqGS:LULU
We Like Lululemon Athletica's (NASDAQ:LULU) Returns And Here's How They're Trending


What are the early trends we should look for to identify a stock that could multiply in value over the long term? One common approach is to try and find a company with returns on capital employed (ROCE) that are increasing, in conjunction with a growing amount of capital employed. This shows us that it's a compounding machine, able to continually reinvest its earnings back into the business and generate higher returns. And in light of that, the trends we're seeing at Lululemon Athletica's (NASDAQ:LULU) look very promising so lets take a look.
Return On Capital Employed (ROCE): What Is It?
For those that aren't sure what ROCE is, it measures the amount of pre-tax profits a company can generate from the capital employed in its business. Analysts use this formula to calculate it for Lululemon Athletica:
Return on Capital Employed = Earnings Before Interest and Tax (EBIT) ÷ (Total Assets - Current Liabilities)
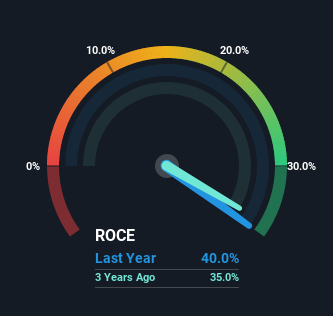
0.40 = US$1.6b ÷ (US$5.3b - US$1.3b) (Based on the trailing twelve months to October 2022).
Therefore, Lululemon Athletica has an ROCE of 40%. In absolute terms that's a great return and it's even better than the Luxury industry average of 17%.
Check out our latest analysis for Lululemon Athletica
In the above chart we have measured Lululemon Athletica's prior ROCE against its prior performance, but the future is arguably more important. If you'd like to see what analysts are forecasting going forward, you should check out our free report for Lululemon Athletica.
What The Trend Of ROCE Can Tell Us
Lululemon Athletica is displaying some positive trends. Over the last five years, returns on capital employed have risen substantially to 40%. Basically the business is earning more per dollar of capital invested and in addition to that, 169% more capital is being employed now too. So we're very much inspired by what we're seeing at Lululemon Athletica thanks to its ability to profitably reinvest capital.
For the record though, there was a noticeable increase in the company's current liabilities over the period, so we would attribute some of the ROCE growth to that. Essentially the business now has suppliers or short-term creditors funding about 25% of its operations, which isn't ideal. It's worth keeping an eye on this because as the percentage of current liabilities to total assets increases, some aspects of risk also increase.
The Bottom Line On Lululemon Athletica's ROCE
All in all, it's terrific to see that Lululemon Athletica is reaping the rewards from prior investments and is growing its capital base. Since the stock has returned a staggering 285% to shareholders over the last five years, it looks like investors are recognizing these changes. In light of that, we think it's worth looking further into this stock because if Lululemon Athletica can keep these trends up, it could have a bright future ahead.
On a final note, we found 2 warning signs for Lululemon Athletica (1 is concerning) you should be aware of.
High returns are a key ingredient to strong performance, so check out our free list ofstocks earning high returns on equity with solid balance sheets.
If you're looking to trade Lululemon Athletica, open an account with the lowest-cost platform trusted by professionals, Interactive Brokers.
With clients in over 200 countries and territories, and access to 160 markets, IBKR lets you trade stocks, options, futures, forex, bonds and funds from a single integrated account.
Enjoy no hidden fees, no account minimums, and FX conversion rates as low as 0.03%, far better than what most brokers offer.
Sponsored ContentNew: AI Stock Screener & Alerts
Our new AI Stock Screener scans the market every day to uncover opportunities.
• Dividend Powerhouses (3%+ Yield)
• Undervalued Small Caps with Insider Buying
• High growth Tech and AI Companies
Or build your own from over 50 metrics.
Have feedback on this article? Concerned about the content? Get in touch with us directly. Alternatively, email editorial-team (at) simplywallst.com.
This article by Simply Wall St is general in nature. We provide commentary based on historical data and analyst forecasts only using an unbiased methodology and our articles are not intended to be financial advice. It does not constitute a recommendation to buy or sell any stock, and does not take account of your objectives, or your financial situation. We aim to bring you long-term focused analysis driven by fundamental data. Note that our analysis may not factor in the latest price-sensitive company announcements or qualitative material. Simply Wall St has no position in any stocks mentioned.
About NasdaqGS:LULU
Lululemon Athletica
Designs, distributes, and retails athletic apparel, footwear, and accessories under the lululemon brand for women and men.
Outstanding track record with flawless balance sheet.

