Advertisement
- United States
- /
- Luxury
- /
- NasdaqGS:LULU
Does the Recent 4.6% Drop Signal an Opportunity in Lululemon Stock for 2025?

Simply Wall St
Reviewed by Bailey Pemberton
Are you staring at lululemon athletica’s stock chart and wondering if those wild swings are a sign to buy, sell, or sit tight? You’re not alone. In a market where companies can be a darling one day and a disappointment the next, lululemon has definitely turned some heads, sometimes for reasons that go beyond just the latest product drop. After an impressive run in previous years, shares have recently been on a rollercoaster, closing at $167.51. Just over the past week, the stock slipped by 4.6%, while a -55.0% year-to-date return and a -52.1% drag over five years might be causing long-term holders some unease.
Part of this change in momentum has been driven by shifts in consumer spending and heightened competition across the athleticwear industry. Broader market jitters and changing risk perceptions among investors have only amplified the ups and downs. Yet, beneath these price moves, something more interesting is going on when you dig into how the company is valued.
Here's something that might surprise you: on a valuation score, a measure that adds a point for each of six key value-focused checks lululemon passes, the company gets a five out of six. That’s a sign it’s ticking most boxes for being undervalued. But how do those checks really stack up, and what do they mean for your next move? Let’s break down the most popular valuation approaches, and stick around, because there’s an even better way to look at this stock’s value coming up.
Why lululemon athletica is lagging behind its peers
Approach 1: lululemon athletica Discounted Cash Flow (DCF) Analysis
The Discounted Cash Flow (DCF) model estimates a company’s value by projecting its future cash flows and then discounting them back to today’s value. This approach helps investors figure out what those streams of cash are worth now, based on both analyst estimates and conservative long-term assumptions.
For lululemon athletica, the latest Free Cash Flow stands at $1.16 Billion. Analyst forecasts suggest this could climb to $1.60 Billion by January 2030, marking steady growth in the underlying business. While analysts have provided detailed projections for the next five years, further estimates are extrapolated to complete a 10-year outlook. This ensures a robust model even as direct inputs taper off.
According to this DCF analysis, lululemon’s fair value comes in at $252.19 per share. With the current price at $167.51, this represents a 33.6% discount to intrinsic value, indicating the stock may be significantly undervalued by the market right now.
Result: UNDERVALUED
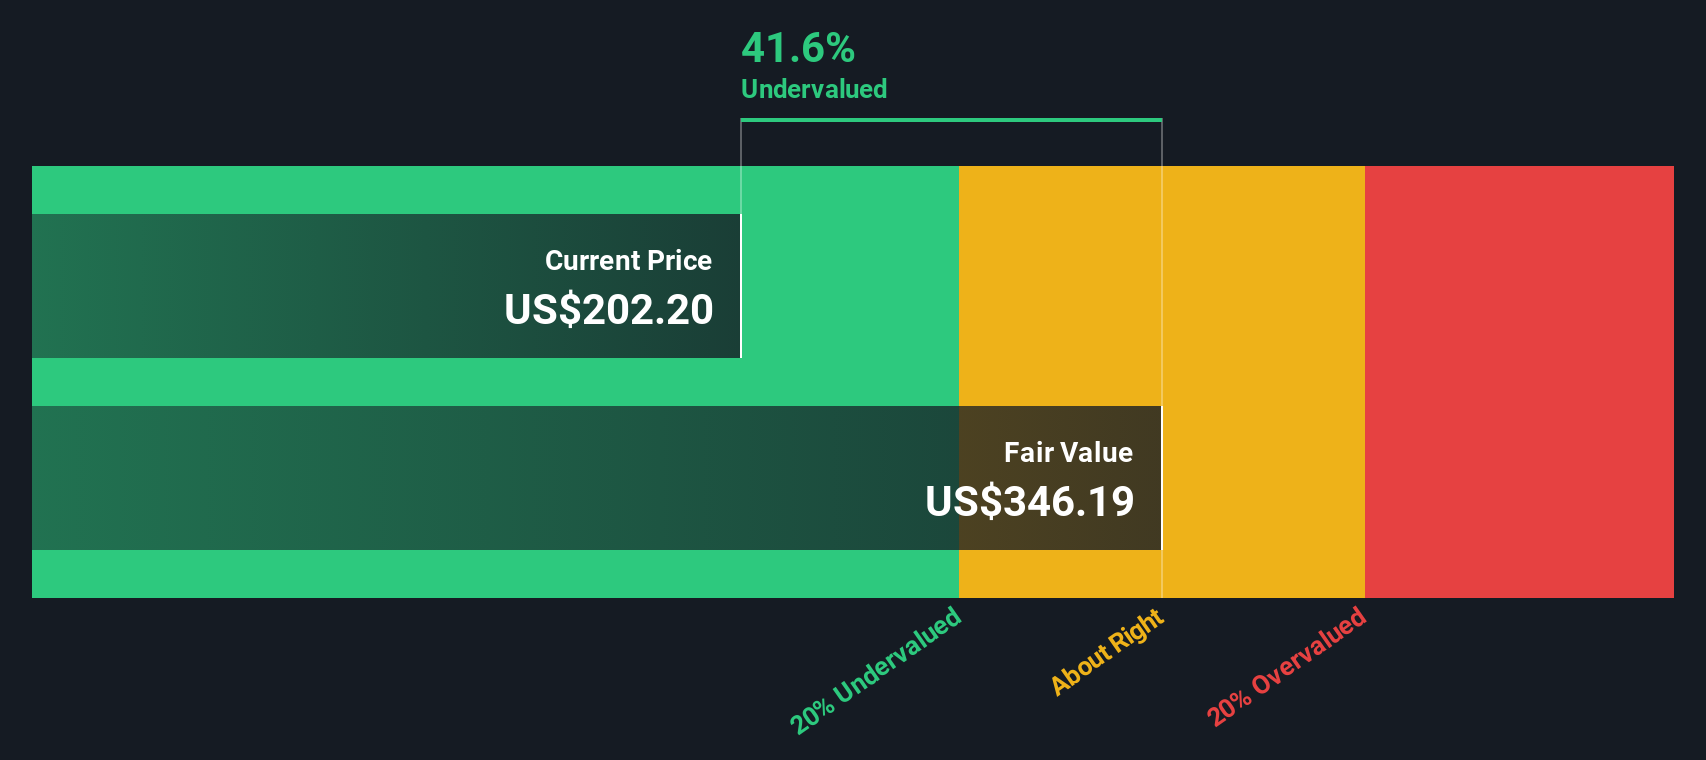
Our Discounted Cash Flow (DCF) analysis suggests lululemon athletica is undervalued by 33.6%. Track this in your watchlist or portfolio, or discover more undervalued stocks.
Approach 2: lululemon athletica Price vs Earnings (PE)
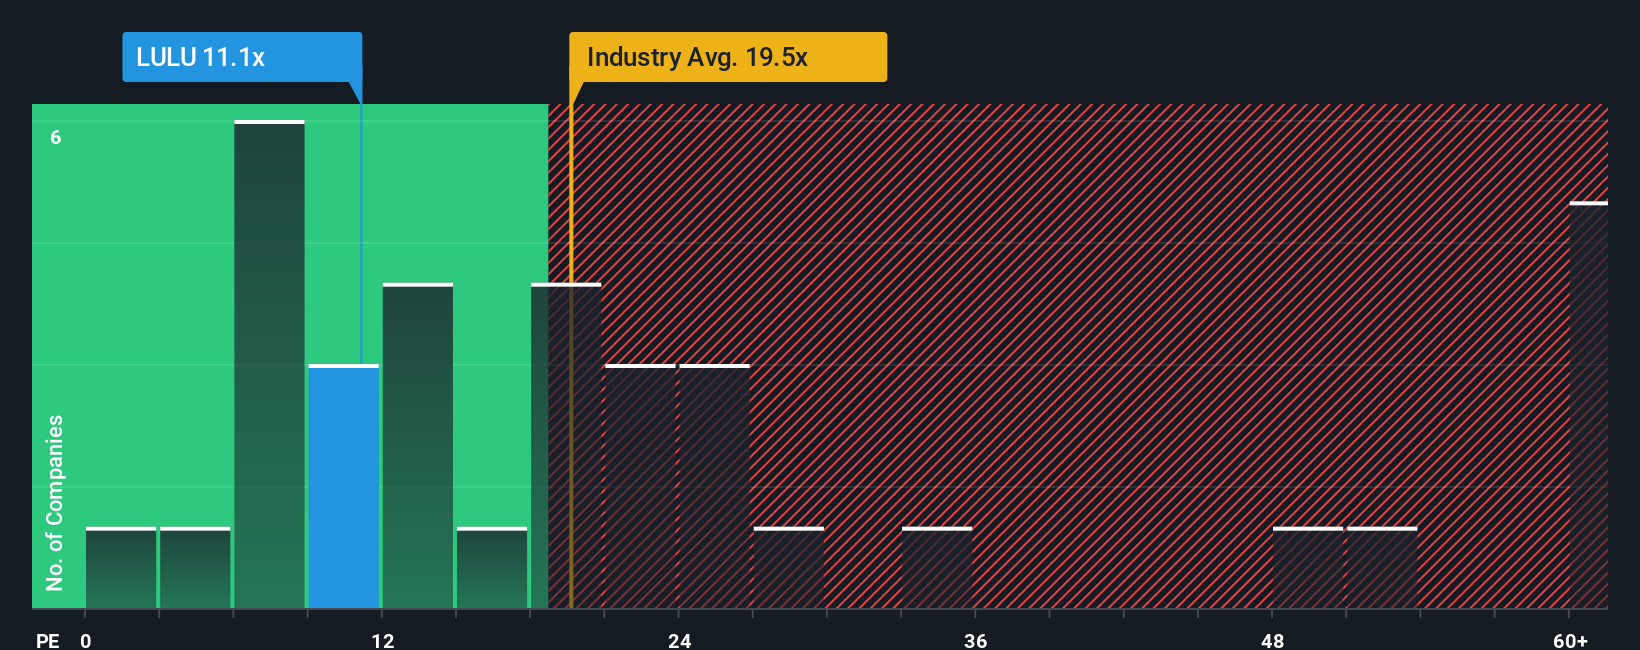
The Price-to-Earnings (PE) ratio is often the go-to metric for valuing profitable companies, because it shows how much investors are willing to pay for each dollar of earnings. For a company like lululemon athletica, which maintains consistent profitability, the PE ratio helps highlight how the market is pricing growth potential versus current profits.
Growth expectations and perceived market risk play a big role in what makes a PE ratio “normal” or “fair” for a stock. Fast-growing, lower-risk companies tend to command higher PE ratios, while more mature or volatile businesses are valued at lower multiples. For lululemon, the current PE sits at 11.12x, compared with the Luxury industry average of 19.76x and a peer group average of 59.63x. This suggests the stock is trading at a meaningful discount relative to both.
Simply Wall St’s proprietary “Fair Ratio” uses a more nuanced approach, combining factors like lululemon’s expected earnings growth, profit margins, risks, industry trends, and market cap to calculate a benchmark multiple specific to the company. Unlike standard industry or peer comparisons, the Fair Ratio in this case is 17.54x and adjusts for what really matters to the business and its investors.
Given lululemon’s actual PE ratio of 11.12x is well below its fair ratio of 17.54x, the data suggest the stock may be meaningfully undervalued on this basis.
Result: UNDERVALUED
PE ratios tell one story, but what if the real opportunity lies elsewhere? Discover companies where insiders are betting big on explosive growth.
Upgrade Your Decision Making: Choose your lululemon athletica Narrative
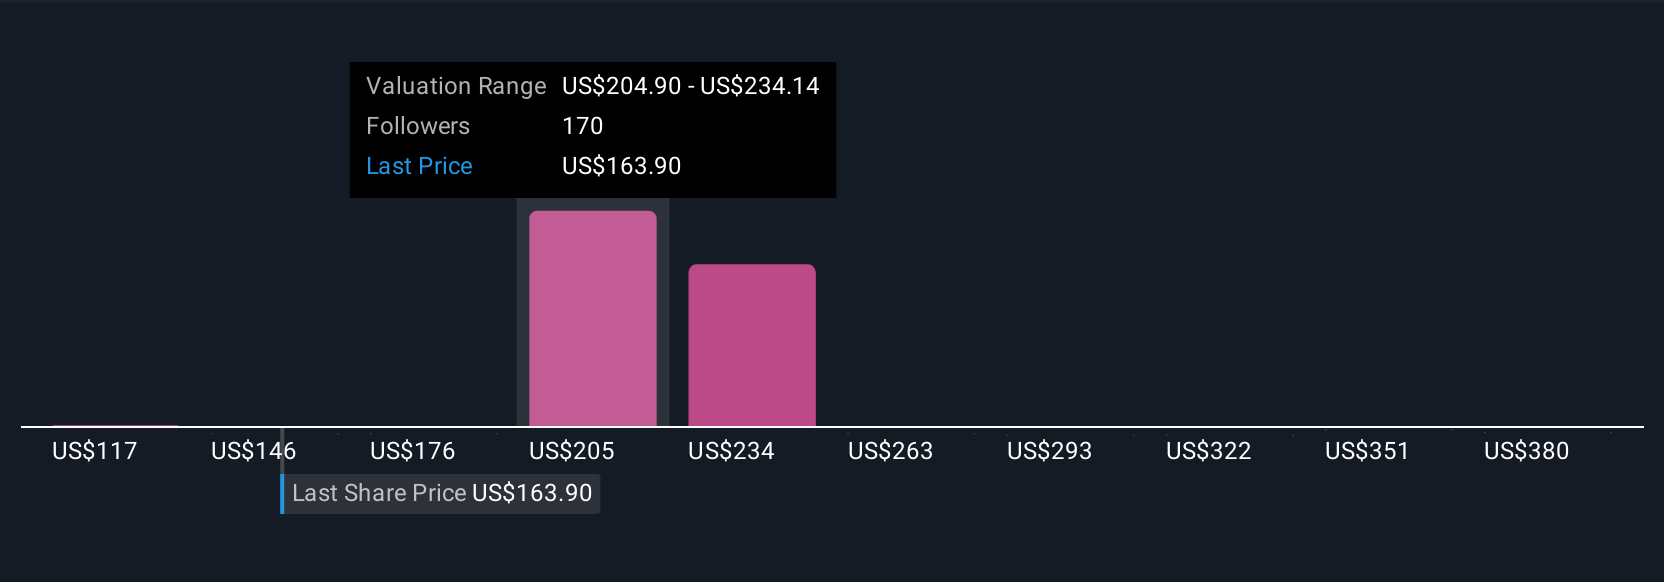
Earlier we mentioned that there’s an even better way to understand valuation. Let’s introduce you to Narratives. On Simply Wall St, Narratives are an easy and accessible tool that allows investors to give a story to the numbers by adding their own view of lululemon athletica’s future, linking their assumptions on revenue, profit margins, and risks directly to a dynamic fair value.
Rather than relying on a single metric or static estimate, Narratives connect a company’s business outlook to a clear financial forecast and a Fair Value which updates automatically when new information, like news, forecasts, or earnings, is published. This gives you the power to adjust your investment thesis on the fly and instantly see if the latest price is above or below your fair value, helping you decide whether to buy, hold, or sell.
You can explore a range of perspectives within the Simply Wall St Community page, used by millions of investors, where Narratives reflect both bullish and bearish outlooks. For example, one Narrative currently projects a fair value of $225.76 based on optimistic growth and improving margins, while another more cautious Narrative values the stock at just $100, highlighting potential margin pressure and tougher competition. This range offers clarity on how different assumptions can radically change your investment decisions.
Do you think there's more to the story for lululemon athletica? Create your own Narrative to let the Community know!
This article by Simply Wall St is general in nature. We provide commentary based on historical data and analyst forecasts only using an unbiased methodology and our articles are not intended to be financial advice. It does not constitute a recommendation to buy or sell any stock, and does not take account of your objectives, or your financial situation. We aim to bring you long-term focused analysis driven by fundamental data. Note that our analysis may not factor in the latest price-sensitive company announcements or qualitative material. Simply Wall St has no position in any stocks mentioned.
Valuation is complex, but we're here to simplify it.
Discover if lululemon athletica might be undervalued or overvalued with our detailed analysis, featuring fair value estimates, potential risks, dividends, insider trades, and its financial condition.
Access Free AnalysisHave feedback on this article? Concerned about the content? Get in touch with us directly. Alternatively, email editorial-team@simplywallst.com
About NasdaqGS:LULU
lululemon athletica
Designs, distributes, and retails technical athletic apparel, footwear, and accessories for women and men under the lululemon brand in the United States, Canada, Mexico, China Mainland, Hong Kong, Taiwan, Macau, and internationally.
Flawless balance sheet and undervalued.
Similar Companies
Market Insights

Advertisement
Community Narratives
A formidable player in AI and enterprise computing.
Fair Value US$210.00|12.2% overvalued
CO
Community Contributor
IREN's Bold Moves in Sustainable Bitcoin Mining & AI Data Centers
Fair Value US$72.52|17.1% undervalued
BL
Community Contributor
Cooling the Champions: The Aussie Tech Behind F1's Victories
Fair Value AU$12.40|38.7% undervalued
TR
Community Contributor