- United States
- /
- Professional Services
- /
- NYSE:SPIR
Spire Global, Inc.'s (NYSE:SPIR) Intrinsic Value Is Potentially 24% Below Its Share Price


Key Insights
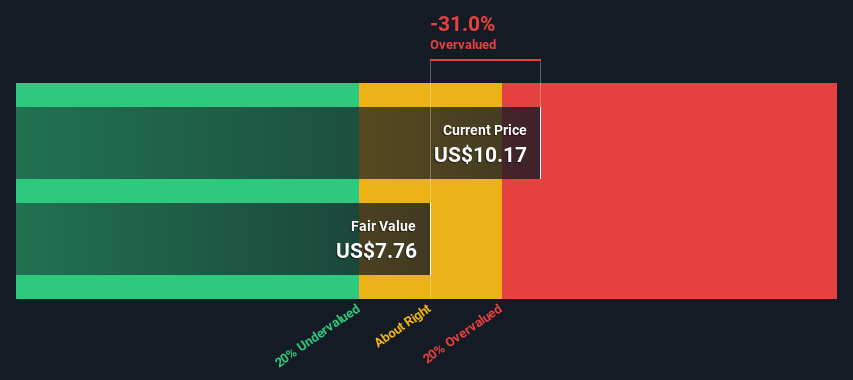
- Spire Global's estimated fair value is US$7.76 based on 2 Stage Free Cash Flow to Equity
- Current share price of US$10.17 suggests Spire Global is potentially 31% overvalued
- Our fair value estimate is 62% lower than Spire Global's analyst price target of US$20.50
Does the April share price for Spire Global, Inc. (NYSE:SPIR) reflect what it's really worth? Today, we will estimate the stock's intrinsic value by taking the expected future cash flows and discounting them to today's value. This will be done using the Discounted Cash Flow (DCF) model. Believe it or not, it's not too difficult to follow, as you'll see from our example!
Remember though, that there are many ways to estimate a company's value, and a DCF is just one method. If you still have some burning questions about this type of valuation, take a look at the Simply Wall St analysis model.
View our latest analysis for Spire Global
The Model
We are going to use a two-stage DCF model, which, as the name states, takes into account two stages of growth. The first stage is generally a higher growth period which levels off heading towards the terminal value, captured in the second 'steady growth' period. To start off with, we need to estimate the next ten years of cash flows. Where possible we use analyst estimates, but when these aren't available we extrapolate the previous free cash flow (FCF) from the last estimate or reported value. We assume companies with shrinking free cash flow will slow their rate of shrinkage, and that companies with growing free cash flow will see their growth rate slow, over this period. We do this to reflect that growth tends to slow more in the early years than it does in later years.
A DCF is all about the idea that a dollar in the future is less valuable than a dollar today, and so the sum of these future cash flows is then discounted to today's value:
10-year free cash flow (FCF) estimate
| 2024 | 2025 | 2026 | 2027 | 2028 | 2029 | 2030 | 2031 | 2032 | 2033 | |
| Levered FCF ($, Millions) | -US$10.2m | US$2.92m | US$4.51m | US$6.26m | US$8.00m | US$9.62m | US$11.0m | US$12.3m | US$13.3m | US$14.2m |
| Growth Rate Estimate Source | Analyst x2 | Analyst x2 | Est @ 54.47% | Est @ 38.81% | Est @ 27.86% | Est @ 20.19% | Est @ 14.82% | Est @ 11.06% | Est @ 8.43% | Est @ 6.59% |
| Present Value ($, Millions) Discounted @ 7.2% | -US$9.6 | US$2.5 | US$3.7 | US$4.7 | US$5.7 | US$6.3 | US$6.8 | US$7.0 | US$7.1 | US$7.1 |
("Est" = FCF growth rate estimated by Simply Wall St)
Present Value of 10-year Cash Flow (PVCF) = US$41m
After calculating the present value of future cash flows in the initial 10-year period, we need to calculate the Terminal Value, which accounts for all future cash flows beyond the first stage. The Gordon Growth formula is used to calculate Terminal Value at a future annual growth rate equal to the 5-year average of the 10-year government bond yield of 2.3%. We discount the terminal cash flows to today's value at a cost of equity of 7.2%.
Terminal Value (TV)= FCF2033 × (1 + g) ÷ (r – g) = US$14m× (1 + 2.3%) ÷ (7.2%– 2.3%) = US$295m
Present Value of Terminal Value (PVTV)= TV / (1 + r)10= US$295m÷ ( 1 + 7.2%)10= US$147m
The total value is the sum of cash flows for the next ten years plus the discounted terminal value, which results in the Total Equity Value, which in this case is US$189m. To get the intrinsic value per share, we divide this by the total number of shares outstanding. Relative to the current share price of US$10.2, the company appears potentially overvalued at the time of writing. Valuations are imprecise instruments though, rather like a telescope - move a few degrees and end up in a different galaxy. Do keep this in mind.
The Assumptions
The calculation above is very dependent on two assumptions. The first is the discount rate and the other is the cash flows. You don't have to agree with these inputs, I recommend redoing the calculations yourself and playing with them. The DCF also does not consider the possible cyclicality of an industry, or a company's future capital requirements, so it does not give a full picture of a company's potential performance. Given that we are looking at Spire Global as potential shareholders, the cost of equity is used as the discount rate, rather than the cost of capital (or weighted average cost of capital, WACC) which accounts for debt. In this calculation we've used 7.2%, which is based on a levered beta of 1.067. Beta is a measure of a stock's volatility, compared to the market as a whole. We get our beta from the industry average beta of globally comparable companies, with an imposed limit between 0.8 and 2.0, which is a reasonable range for a stable business.
SWOT Analysis for Spire Global
- Debt is well covered by earnings.
- Shareholders have been diluted in the past year.
- Forecast to reduce losses next year.
- Good value based on P/S ratio compared to estimated Fair P/S ratio.
- Debt is not well covered by operating cash flow.
- Has less than 3 years of cash runway based on current free cash flow.
- Not expected to become profitable over the next 3 years.
Moving On:
Valuation is only one side of the coin in terms of building your investment thesis, and it is only one of many factors that you need to assess for a company. It's not possible to obtain a foolproof valuation with a DCF model. Preferably you'd apply different cases and assumptions and see how they would impact the company's valuation. For instance, if the terminal value growth rate is adjusted slightly, it can dramatically alter the overall result. Why is the intrinsic value lower than the current share price? For Spire Global, we've compiled three essential items you should consider:
- Risks: To that end, you should learn about the 3 warning signs we've spotted with Spire Global (including 1 which is a bit unpleasant) .
- Future Earnings: How does SPIR's growth rate compare to its peers and the wider market? Dig deeper into the analyst consensus number for the upcoming years by interacting with our free analyst growth expectation chart.
- Other High Quality Alternatives: Do you like a good all-rounder? Explore our interactive list of high quality stocks to get an idea of what else is out there you may be missing!
PS. The Simply Wall St app conducts a discounted cash flow valuation for every stock on the NYSE every day. If you want to find the calculation for other stocks just search here.
If you're looking to trade Spire Global, open an account with the lowest-cost platform trusted by professionals, Interactive Brokers.
With clients in over 200 countries and territories, and access to 160 markets, IBKR lets you trade stocks, options, futures, forex, bonds and funds from a single integrated account.
Enjoy no hidden fees, no account minimums, and FX conversion rates as low as 0.03%, far better than what most brokers offer.
Sponsored ContentNew: Manage All Your Stock Portfolios in One Place
We've created the ultimate portfolio companion for stock investors, and it's free.
• Connect an unlimited number of Portfolios and see your total in one currency
• Be alerted to new Warning Signs or Risks via email or mobile
• Track the Fair Value of your stocks
Have feedback on this article? Concerned about the content? Get in touch with us directly. Alternatively, email editorial-team (at) simplywallst.com.
This article by Simply Wall St is general in nature. We provide commentary based on historical data and analyst forecasts only using an unbiased methodology and our articles are not intended to be financial advice. It does not constitute a recommendation to buy or sell any stock, and does not take account of your objectives, or your financial situation. We aim to bring you long-term focused analysis driven by fundamental data. Note that our analysis may not factor in the latest price-sensitive company announcements or qualitative material. Simply Wall St has no position in any stocks mentioned.
About NYSE:SPIR
Spire Global
Provides subscription-based data, insights, predictive analytics, and related project-based services worldwide.
Slight with worrying balance sheet.
Similar Companies
Market Insights

Community Narratives

