

David Iben put it well when he said, 'Volatility is not a risk we care about. What we care about is avoiding the permanent loss of capital.' It's only natural to consider a company's balance sheet when you examine how risky it is, since debt is often involved when a business collapses. We note that Rollins, Inc. (NYSE:ROL) does have debt on its balance sheet. But is this debt a concern to shareholders?
When Is Debt A Problem?
Debt assists a business until the business has trouble paying it off, either with new capital or with free cash flow. Part and parcel of capitalism is the process of 'creative destruction' where failed businesses are mercilessly liquidated by their bankers. However, a more frequent (but still costly) occurrence is where a company must issue shares at bargain-basement prices, permanently diluting shareholders, just to shore up its balance sheet. Having said that, the most common situation is where a company manages its debt reasonably well - and to its own advantage. The first step when considering a company's debt levels is to consider its cash and debt together.
View our latest analysis for Rollins
What Is Rollins's Debt?
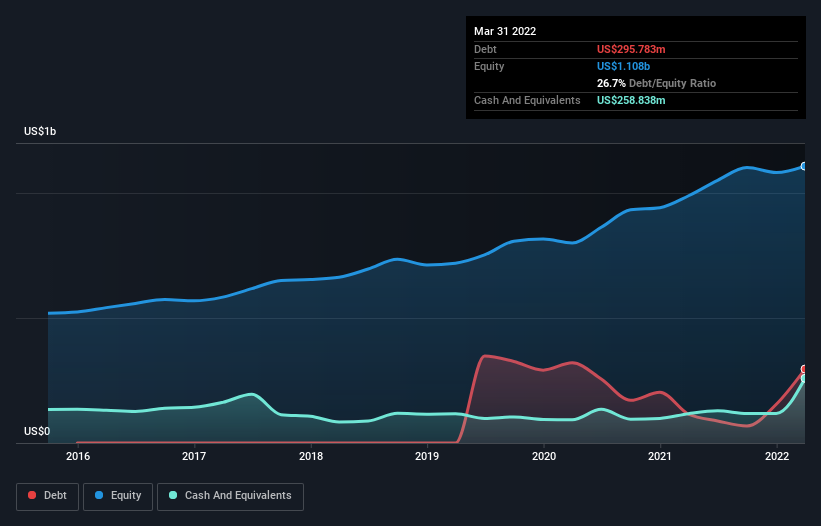
The image below, which you can click on for greater detail, shows that at March 2022 Rollins had debt of US$295.8m, up from US$115.2m in one year. However, because it has a cash reserve of US$258.8m, its net debt is less, at about US$36.9m.
A Look At Rollins' Liabilities
Zooming in on the latest balance sheet data, we can see that Rollins had liabilities of US$480.9m due within 12 months and liabilities of US$542.7m due beyond that. On the other hand, it had cash of US$258.8m and US$164.3m worth of receivables due within a year. So its liabilities total US$600.5m more than the combination of its cash and short-term receivables.
Given Rollins has a humongous market capitalization of US$17.9b, it's hard to believe these liabilities pose much threat. Having said that, it's clear that we should continue to monitor its balance sheet, lest it change for the worse. But either way, Rollins has virtually no net debt, so it's fair to say it does not have a heavy debt load!
In order to size up a company's debt relative to its earnings, we calculate its net debt divided by its earnings before interest, tax, depreciation, and amortization (EBITDA) and its earnings before interest and tax (EBIT) divided by its interest expense (its interest cover). Thus we consider debt relative to earnings both with and without depreciation and amortization expenses.
With debt at a measly 0.069 times EBITDA and EBIT covering interest a whopping 560 times, it's clear that Rollins is not a desperate borrower. Indeed relative to its earnings its debt load seems light as a feather. Also good is that Rollins grew its EBIT at 11% over the last year, further increasing its ability to manage debt. There's no doubt that we learn most about debt from the balance sheet. But ultimately the future profitability of the business will decide if Rollins can strengthen its balance sheet over time. So if you're focused on the future you can check out this free report showing analyst profit forecasts.
Finally, a company can only pay off debt with cold hard cash, not accounting profits. So we clearly need to look at whether that EBIT is leading to corresponding free cash flow. During the last three years, Rollins generated free cash flow amounting to a very robust 95% of its EBIT, more than we'd expect. That positions it well to pay down debt if desirable to do so.
Our View
Happily, Rollins's impressive interest cover implies it has the upper hand on its debt. And that's just the beginning of the good news since its conversion of EBIT to free cash flow is also very heartening. Overall, we don't think Rollins is taking any bad risks, as its debt load seems modest. So the balance sheet looks pretty healthy, to us. Above most other metrics, we think its important to track how fast earnings per share is growing, if at all. If you've also come to that realization, you're in luck, because today you can view this interactive graph of Rollins's earnings per share history for free.
If you're interested in investing in businesses that can grow profits without the burden of debt, then check out this free list of growing businesses that have net cash on the balance sheet.
New: AI Stock Screener & Alerts
Our new AI Stock Screener scans the market every day to uncover opportunities.
• Dividend Powerhouses (3%+ Yield)
• Undervalued Small Caps with Insider Buying
• High growth Tech and AI Companies
Or build your own from over 50 metrics.
Have feedback on this article? Concerned about the content? Get in touch with us directly. Alternatively, email editorial-team (at) simplywallst.com.
This article by Simply Wall St is general in nature. We provide commentary based on historical data and analyst forecasts only using an unbiased methodology and our articles are not intended to be financial advice. It does not constitute a recommendation to buy or sell any stock, and does not take account of your objectives, or your financial situation. We aim to bring you long-term focused analysis driven by fundamental data. Note that our analysis may not factor in the latest price-sensitive company announcements or qualitative material. Simply Wall St has no position in any stocks mentioned.
About NYSE:ROL
Rollins
Through its subsidiaries, provides pest and wildlife control services to residential and commercial customers in the United States and internationally.
Proven track record with adequate balance sheet.
Similar Companies
Market Insights

Community Narratives

