

The external fund manager backed by Berkshire Hathaway's Charlie Munger, Li Lu, makes no bones about it when he says 'The biggest investment risk is not the volatility of prices, but whether you will suffer a permanent loss of capital.' When we think about how risky a company is, we always like to look at its use of debt, since debt overload can lead to ruin. We can see that Parsons Corporation (NYSE:PSN) does use debt in its business. But the more important question is: how much risk is that debt creating?
When Is Debt A Problem?
Debt and other liabilities become risky for a business when it cannot easily fulfill those obligations, either with free cash flow or by raising capital at an attractive price. Ultimately, if the company can't fulfill its legal obligations to repay debt, shareholders could walk away with nothing. However, a more frequent (but still costly) occurrence is where a company must issue shares at bargain-basement prices, permanently diluting shareholders, just to shore up its balance sheet. Of course, plenty of companies use debt to fund growth, without any negative consequences. When we think about a company's use of debt, we first look at cash and debt together.
Check out our latest analysis for Parsons
How Much Debt Does Parsons Carry?
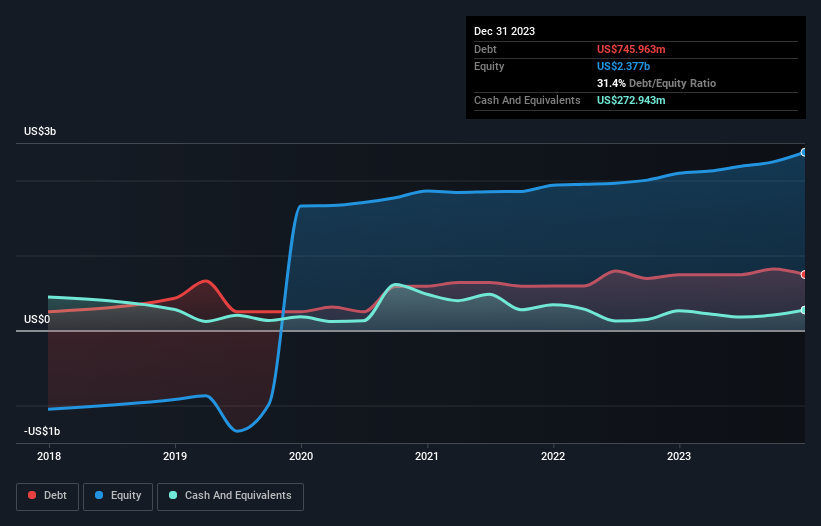
The chart below, which you can click on for greater detail, shows that Parsons had US$746.0m in debt in December 2023; about the same as the year before. On the flip side, it has US$272.9m in cash leading to net debt of about US$473.0m.
How Healthy Is Parsons' Balance Sheet?
We can see from the most recent balance sheet that Parsons had liabilities of US$1.41b falling due within a year, and liabilities of US$1.02b due beyond that. Offsetting these obligations, it had cash of US$272.9m as well as receivables valued at US$1.67b due within 12 months. So it has liabilities totalling US$481.3m more than its cash and near-term receivables, combined.
Given Parsons has a market capitalization of US$8.59b, it's hard to believe these liabilities pose much threat. Having said that, it's clear that we should continue to monitor its balance sheet, lest it change for the worse.
In order to size up a company's debt relative to its earnings, we calculate its net debt divided by its earnings before interest, tax, depreciation, and amortization (EBITDA) and its earnings before interest and tax (EBIT) divided by its interest expense (its interest cover). Thus we consider debt relative to earnings both with and without depreciation and amortization expenses.
Parsons's net debt is only 1.0 times its EBITDA. And its EBIT covers its interest expense a whopping 11.6 times over. So you could argue it is no more threatened by its debt than an elephant is by a mouse. In addition to that, we're happy to report that Parsons has boosted its EBIT by 92%, thus reducing the spectre of future debt repayments. When analysing debt levels, the balance sheet is the obvious place to start. But it is future earnings, more than anything, that will determine Parsons's ability to maintain a healthy balance sheet going forward. So if you're focused on the future you can check out this free report showing analyst profit forecasts.
But our final consideration is also important, because a company cannot pay debt with paper profits; it needs cold hard cash. So it's worth checking how much of that EBIT is backed by free cash flow. Happily for any shareholders, Parsons actually produced more free cash flow than EBIT over the last three years. That sort of strong cash generation warms our hearts like a puppy in a bumblebee suit.
Our View
Happily, Parsons's impressive conversion of EBIT to free cash flow implies it has the upper hand on its debt. And the good news does not stop there, as its EBIT growth rate also supports that impression! We think Parsons is no more beholden to its lenders, than the birds are to birdwatchers. For investing nerds like us its balance sheet is almost charming. Over time, share prices tend to follow earnings per share, so if you're interested in Parsons, you may well want to click here to check an interactive graph of its earnings per share history.
If you're interested in investing in businesses that can grow profits without the burden of debt, then check out this free list of growing businesses that have net cash on the balance sheet.
New: Manage All Your Stock Portfolios in One Place
We've created the ultimate portfolio companion for stock investors, and it's free.
• Connect an unlimited number of Portfolios and see your total in one currency
• Be alerted to new Warning Signs or Risks via email or mobile
• Track the Fair Value of your stocks
Have feedback on this article? Concerned about the content? Get in touch with us directly. Alternatively, email editorial-team (at) simplywallst.com.
This article by Simply Wall St is general in nature. We provide commentary based on historical data and analyst forecasts only using an unbiased methodology and our articles are not intended to be financial advice. It does not constitute a recommendation to buy or sell any stock, and does not take account of your objectives, or your financial situation. We aim to bring you long-term focused analysis driven by fundamental data. Note that our analysis may not factor in the latest price-sensitive company announcements or qualitative material. Simply Wall St has no position in any stocks mentioned.
About NYSE:PSN
Parsons
Provides integrated solutions and services in the defense, intelligence, and critical infrastructure markets in North America, the Middle East, and internationally.
Solid track record with excellent balance sheet.
Similar Companies
Market Insights

Community Narratives

