- United States
- /
- Commercial Services
- /
- NYSE:BRC
Does the Recent Drop in Brady Shares Signal a Long-Term Opportunity in 2025?

Reviewed by Bailey Pemberton
If you’re eyeing Brady stock and wondering whether now is the time to get in, you’re not alone. After a few years of impressive growth, with shares more than doubling over five years (up 94.2%), the stock has cooled a bit, dropping 5.6% in the past week and 8.2% over the last month. Year-to-date, it is basically flat, and over the last twelve months, performance is just under zero, at -0.2%. For a company that is usually associated with steady, long-term expansion, these recent slips are worth paying attention to. Some of this volatility can be traced to broader market uncertainty, sparking a fresh look at risk and opportunity in industrial names like Brady.
But here is where it gets interesting: Brady’s valuation score is 5 out of 6, meaning the company looks undervalued in nearly every way analysts can check. With this in mind, investors are asking if the market is missing something, or if there is a reason for this discount.
Let’s dig into the numbers using different valuation lenses, and, as we will see, there might be an even smarter way to evaluate Brady’s real worth that goes beyond the usual methods.
Approach 1: Brady Discounted Cash Flow (DCF) Analysis
The Discounted Cash Flow (DCF) model works by projecting a company’s future cash flows and then discounting them back to today’s value. This approach aims to estimate what the business is really worth compared to its current stock price.
For Brady, the latest twelve months’ Free Cash Flow stands at $135.4 Million. Analysts forecast growth in these cash flows, projecting a steady rise. By 2027, estimates see Free Cash Flow rising to about $255.6 Million. Longer-term projections, based on analyst models and Simply Wall St's own extrapolation, extend out to over $312 Million by 2035.
All cash flow projections here are in US dollars and reflect the company’s expected performance year over year. Although the DCF model relies on assumptions about future growth, it is notable that Brady’s intrinsic value based on these cash flow forecasts is $130.65 per share.
Against the current share price, this DCF calculation suggests that Brady is trading at a 43.5% discount. In other words, the market is valuing the company well below what its future cash flow potential appears to justify. This implies significant upside for long-term investors.
Result: UNDERVALUED
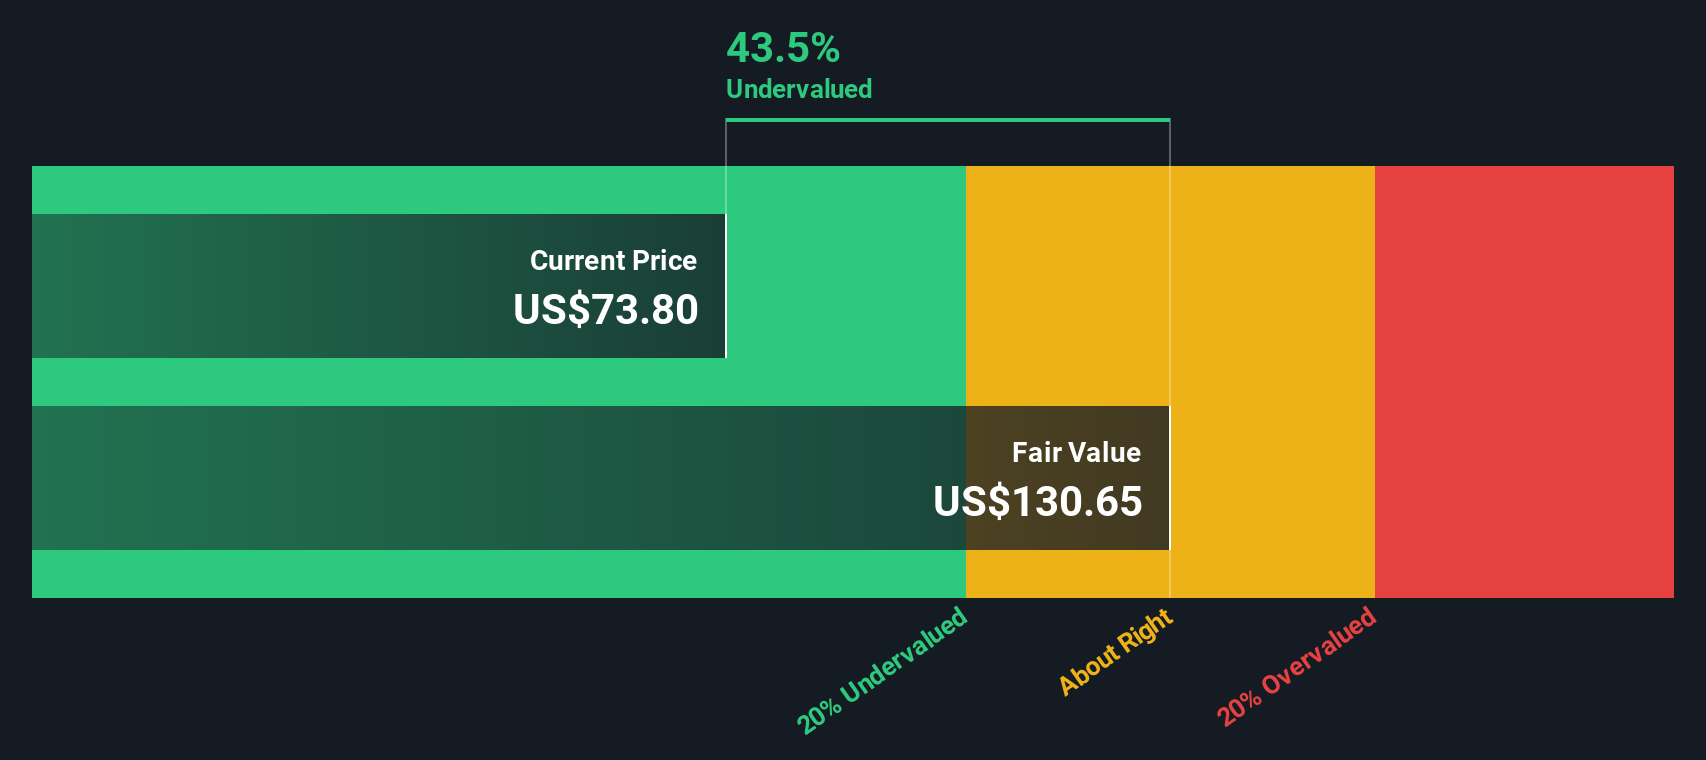
Our Discounted Cash Flow (DCF) analysis suggests Brady is undervalued by 43.5%. Track this in your watchlist or portfolio, or discover more undervalued stocks.
Approach 2: Brady Price vs Earnings (PE Ratio)
The Price-to-Earnings (PE) ratio is a tried and tested valuation tool, especially relevant for profitable companies like Brady. It measures how much investors are willing to pay today for a dollar of earnings, making it a quick gauge of whether a stock appears cheap or expensive relative to its profits.
Setting the 'right' PE ratio depends on several factors. Higher expected earnings growth typically justifies a higher PE, while increased risk or structural challenges in a business usually warrant a lower multiple. Instead of only looking at raw numbers, it is important to consider the company’s growth profile and risk level when judging if the PE is reasonable.
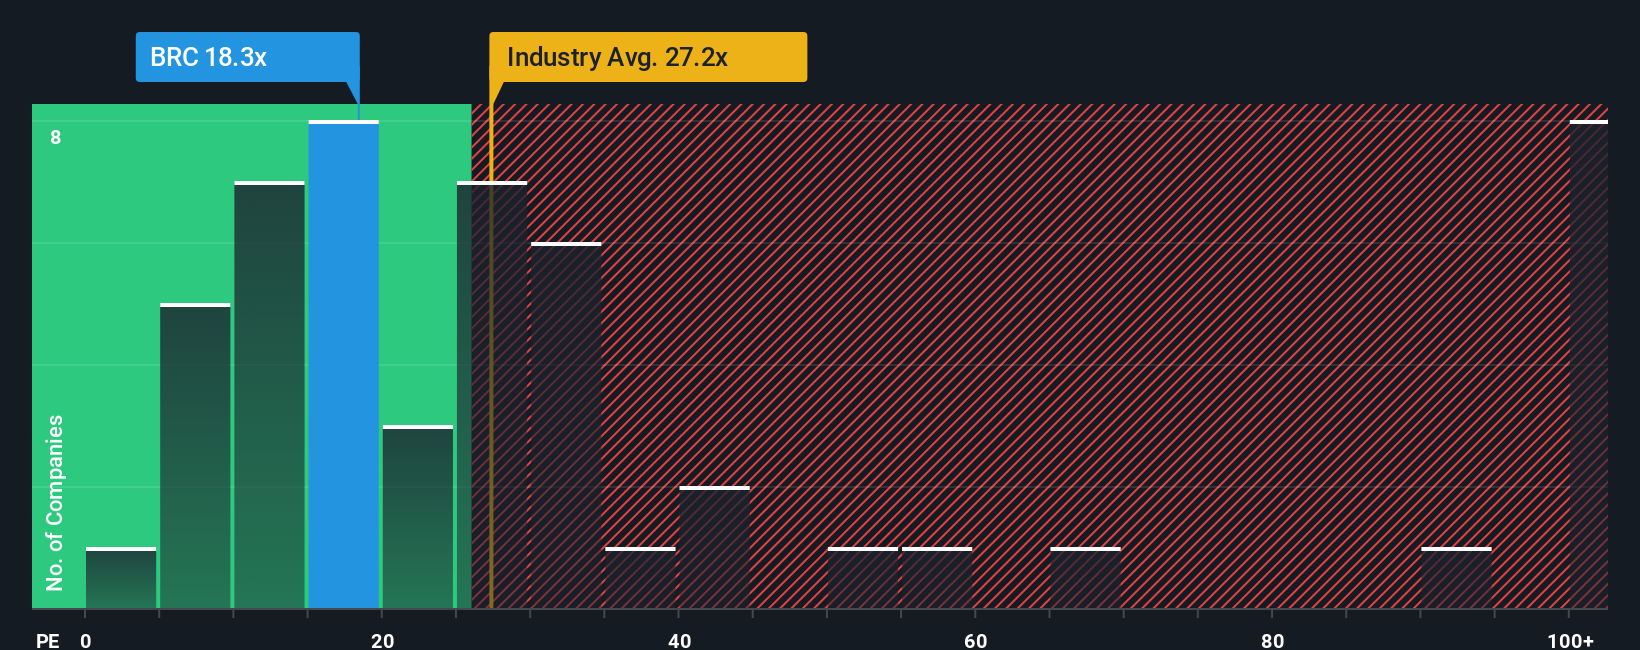
Brady’s current PE stands at 18.4x, which on the surface is lower than the overall industry average of 28.2x and significantly beneath the average among close peers at 37.4x. At first glance, this discount might suggest Brady is undervalued against its rivals. However, not all companies in the sector share the same growth, stability, or risk profile, which can skew simple peer comparisons.
This is where Simply Wall St’s proprietary “Fair Ratio” steps in. It goes beyond basic benchmarks by accounting for unique elements such as Brady’s earnings growth expectations, profit margins, industry specifics, market capitalization, and risk factors. Brady’s Fair Ratio is calculated to be 23.9x, which is higher than its current PE. This suggests that, after adjusting for what really matters, Brady is trading below the PE multiple it deserves based on its fundamentals.
Comparing this Fair Ratio with the company's actual PE leaves us with a clear message: Brady looks undervalued using this approach.
Result: UNDERVALUED
PE ratios tell one story, but what if the real opportunity lies elsewhere? Discover companies where insiders are betting big on explosive growth.
Upgrade Your Decision Making: Choose your Brady Narrative
Earlier we mentioned that there is an even better way to understand valuation, so let us introduce you to Narratives. A Narrative is simply your story about a company, a way to frame what you believe about Brady’s future in terms of its revenue, earnings, and profit margins, then see how those beliefs connect to a fair value for the stock. Narratives go beyond spreadsheets, making it easy for any investor to combine their perspective with the numbers so you can see what a company is truly worth to you, not just the market.
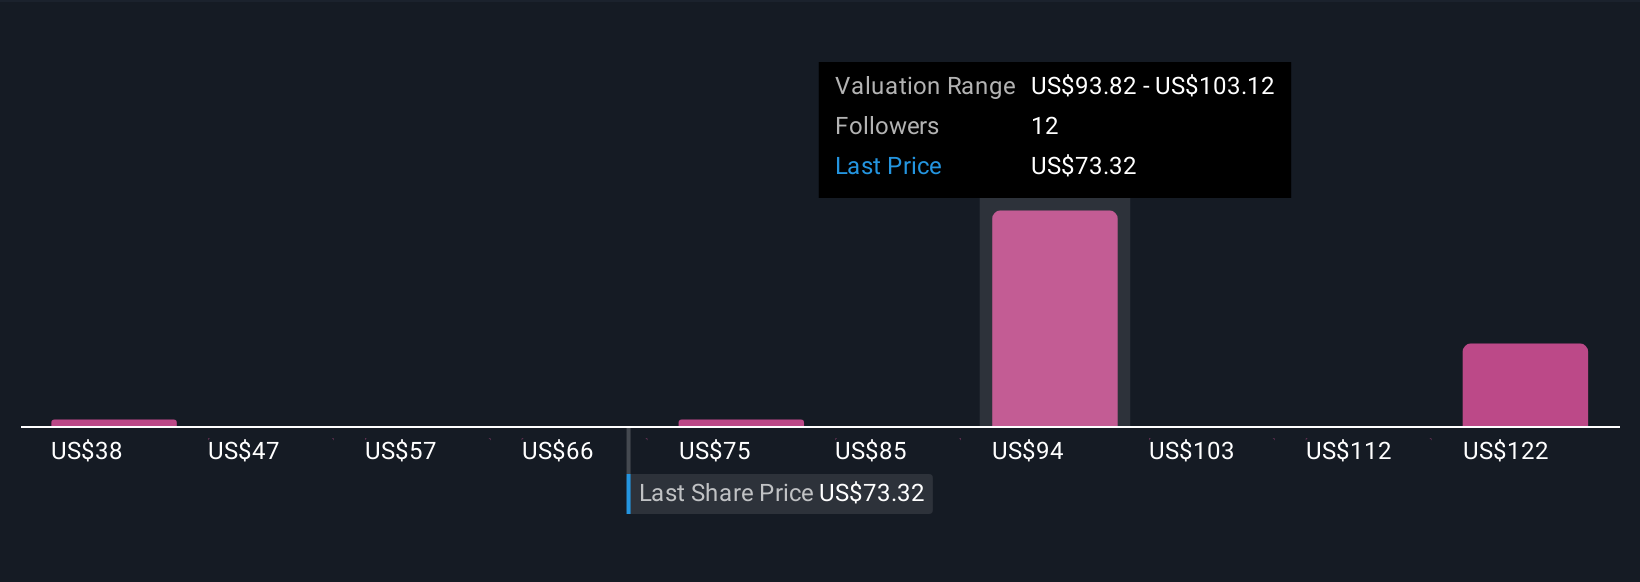
On Simply Wall St’s Community page, millions of investors can quickly create and refine their own Narratives by adjusting estimates or growth assumptions in a visual forecast tool that updates fair value in real time as new news or earnings arrive. This approach helps you make smarter decisions, such as when to buy or sell, by letting you directly compare the current share price with your fair value based on what you believe and the latest data. For example, some Brady Narratives reflect high optimism about margin expansion and global growth, suggesting a fair value as high as $110, while others anticipate slower growth or persistent industry risks, resulting in a fair value closer to $83.
Do you think there's more to the story for Brady? Create your own Narrative to let the Community know!
This article by Simply Wall St is general in nature. We provide commentary based on historical data and analyst forecasts only using an unbiased methodology and our articles are not intended to be financial advice. It does not constitute a recommendation to buy or sell any stock, and does not take account of your objectives, or your financial situation. We aim to bring you long-term focused analysis driven by fundamental data. Note that our analysis may not factor in the latest price-sensitive company announcements or qualitative material. Simply Wall St has no position in any stocks mentioned.
Mobile Infrastructure for Defense and Disaster
The next wave in robotics isn't humanoid. Its fully autonomous towers delivering 5G, ISR, and radar in under 30 minutes, anywhere.
Get the investor briefing before the next round of contracts
Sponsored On Behalf of CiTechValuation is complex, but we're here to simplify it.
Discover if Brady might be undervalued or overvalued with our detailed analysis, featuring fair value estimates, potential risks, dividends, insider trades, and its financial condition.
Access Free AnalysisHave feedback on this article? Concerned about the content? Get in touch with us directly. Alternatively, email editorial-team@simplywallst.com
About NYSE:BRC
Brady
Manufactures and supplies identification solutions and workplace safety products that identify and protect premises, products, and people in the Americas, Asia, Europe, and Australia.
Undervalued with excellent balance sheet and pays a dividend.
Similar Companies
Market Insights

Weekly Picks

THE KINGDOM OF BROWN GOODS: WHY MGPI IS BEING CRUSHED BY INVENTORY & PRIMED FOR RESURRECTION


Why Vertical Aerospace (NYSE: EVTL) is Worth Possibly Over 13x its Current Price


The Quiet Giant That Became AI’s Power Grid
Recently Updated Narratives

Agfa-Gevaert is a digital and materials turnaround opportunity, with growth potential in ZIRFON, but carrying legacy risks.

Hitit Bilgisayar Hizmetleri will achieve a 19.7% revenue boost in the next five years


MINISO's fair value is projected at 26.69 with an anticipated PE ratio shift of 20x
Popular Narratives


MicroVision will explode future revenue by 380.37% with a vision towards success


Crazy Undervalued 42 Baggers Silver Play (Active & Running Mine)


