Advertisement
- United States
- /
- Professional Services
- /
- NYSE:BR
What Recent Earnings Mean for Broadridge Shares in 2025

Simply Wall St
Reviewed by Bailey Pemberton
Thinking about what to do with your Broadridge Financial Solutions shares? It is a common question lately, especially as the stock continues to draw attention from both steady hands and new investors. Broadridge is not your typical, high-volatility tech play, but it still boasts a return of 10.4% over the last year and a staggering 69.0% in the past three years, offering some solid proof of its long-term growth potential. That said, recent momentum has cooled a bit, with the stock down 0.5% over the past week and off 7.3% in the past month. This performance may reflect shifts in market sentiment or broader sector rotations rather than company-specific red flags.
Despite these near-term moves, a year-to-date gain of 3.0% and an impressive 82.6% five-year climb show why Broadridge is still on many investors’ watch lists. The company’s value score currently stands at 2 out of 6, meaning it is undervalued in only 2 of the 6 major valuation checks analysts typically use. So, the big question for those eyeing Broadridge right now is how to interpret this blend of moderate undervaluation and strong historical performance. To dig deeper, let’s break down the popular valuation approaches. Stay tuned for an even more insightful way to think about what Broadridge is truly worth at the end of this article.
Broadridge Financial Solutions scores just 2/6 on our valuation checks. See what other red flags we found in the full valuation breakdown.
Approach 1: Broadridge Financial Solutions Discounted Cash Flow (DCF) Analysis
A Discounted Cash Flow (DCF) model values a company by estimating all future cash flows it is expected to generate and then discounting those amounts back to today’s dollars to arrive at an intrinsic value. This approach helps investors determine what the company is truly worth based on its future earnings potential rather than only current profits.
For Broadridge Financial Solutions, the DCF analysis starts with its latest twelve months of Free Cash Flow, which stands at $1.06 billion. Analysts provide specific estimates for the next five years, projecting gradual growth each year. Future cash flow is projected to climb steadily, reaching around $1.72 billion by 2030. Conservative growth assumptions are used for the years beyond direct analyst coverage.
Based on these projections, the model calculates an intrinsic value of $326.41 per share for Broadridge. This represents an implied discount of 28.4 percent, suggesting that the market is currently undervaluing the company compared to its anticipated cash flow generation.
Result: UNDERVALUED
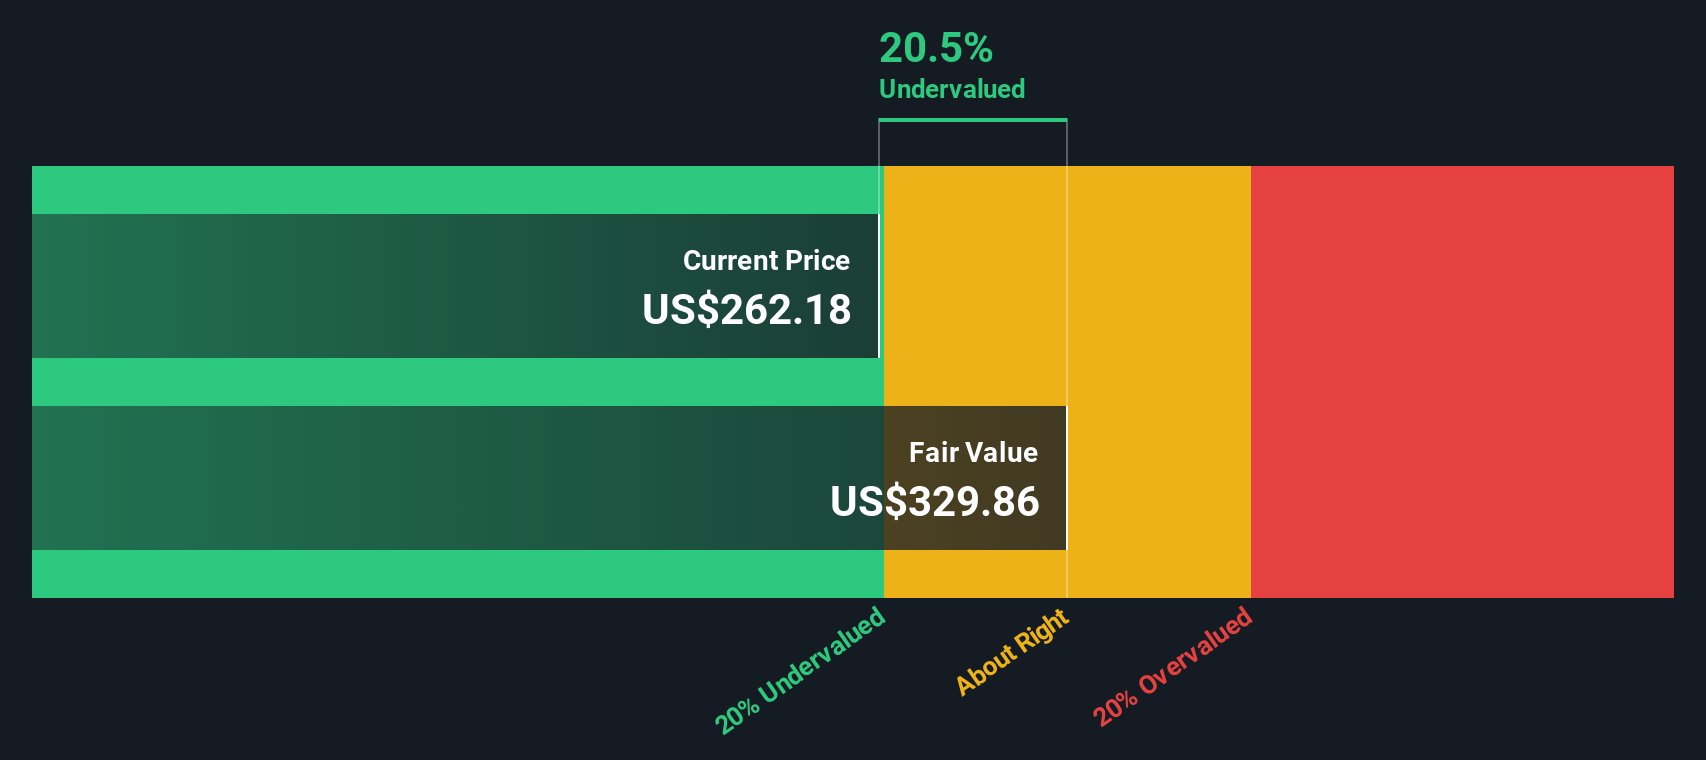
Our Discounted Cash Flow (DCF) analysis suggests Broadridge Financial Solutions is undervalued by 28.4%. Track this in your watchlist or portfolio, or discover more undervalued stocks.
Approach 2: Broadridge Financial Solutions Price vs Earnings (PE) Ratio
The Price-to-Earnings (PE) ratio is a key valuation metric for companies like Broadridge Financial Solutions that generate consistent profits. It offers a quick way to gauge what investors are willing to pay today for each dollar of expected earnings, making it particularly relevant for established, profitable businesses.
It is important to remember that comparing PE ratios is not simply about one company versus another. Expectations for future growth and the riskiness of those earnings play a significant role in determining what counts as a fair or normal multiple. A company with higher growth or a safer, more predictable business model typically justifies a higher PE than a slower, riskier peer.
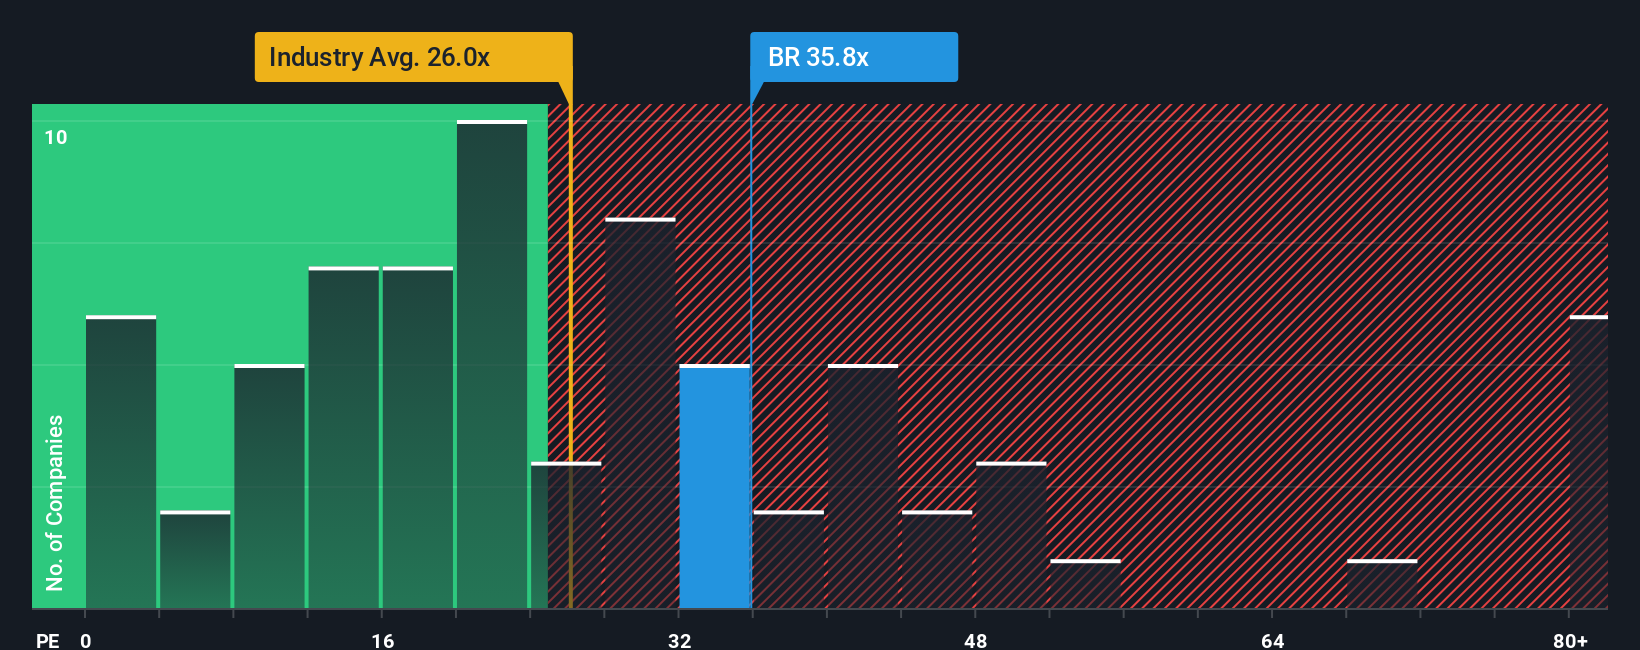
Currently, Broadridge trades at a PE ratio of 32.6x. This is notably higher than the industry average of 26.7x and the peer group average of 21.5x. However, Simply Wall St calculates a Fair Ratio of 29.2x for Broadridge, which reflects factors such as its earnings growth outlook, industry dynamics, profit margins, market capitalization, and specific risks unique to the business. This Fair Ratio provides a more tailored benchmark than a simple industry average, since it holistically weighs everything that makes Broadridge distinct, including qualities that may justify a premium valuation.
With Broadridge’s current PE sitting just slightly above its Fair Ratio, the stock appears to be priced about right based on its underlying fundamentals and growth prospects.
Result: ABOUT RIGHT
PE ratios tell one story, but what if the real opportunity lies elsewhere? Discover companies where insiders are betting big on explosive growth.
Upgrade Your Decision Making: Choose your Broadridge Financial Solutions Narrative
Earlier, we mentioned there is an even better way to understand valuation. Let’s introduce you to Narratives. A Narrative is simply your take on a company, a story that brings together your financial forecasts, your view of future revenue, earnings and margins, and your idea of what the stock is really worth. Rather than just relying on formulas or industry averages, Narratives let you connect the company’s business story to a personal forecast and a calculated fair value, providing a clear why behind your investment decision.
On Simply Wall St’s Community page, millions of investors use Narratives to shape their own perspectives for companies like Broadridge Financial Solutions. It is easy and accessible, encouraging you to look beyond the numbers, voice your outlook, and instantly compare your view to others, including analysts, contrarians, and individual investors. Narratives show when your calculated Fair Value is higher or lower than the market price, helping you judge whether it is a good time to buy, sell, or hold.
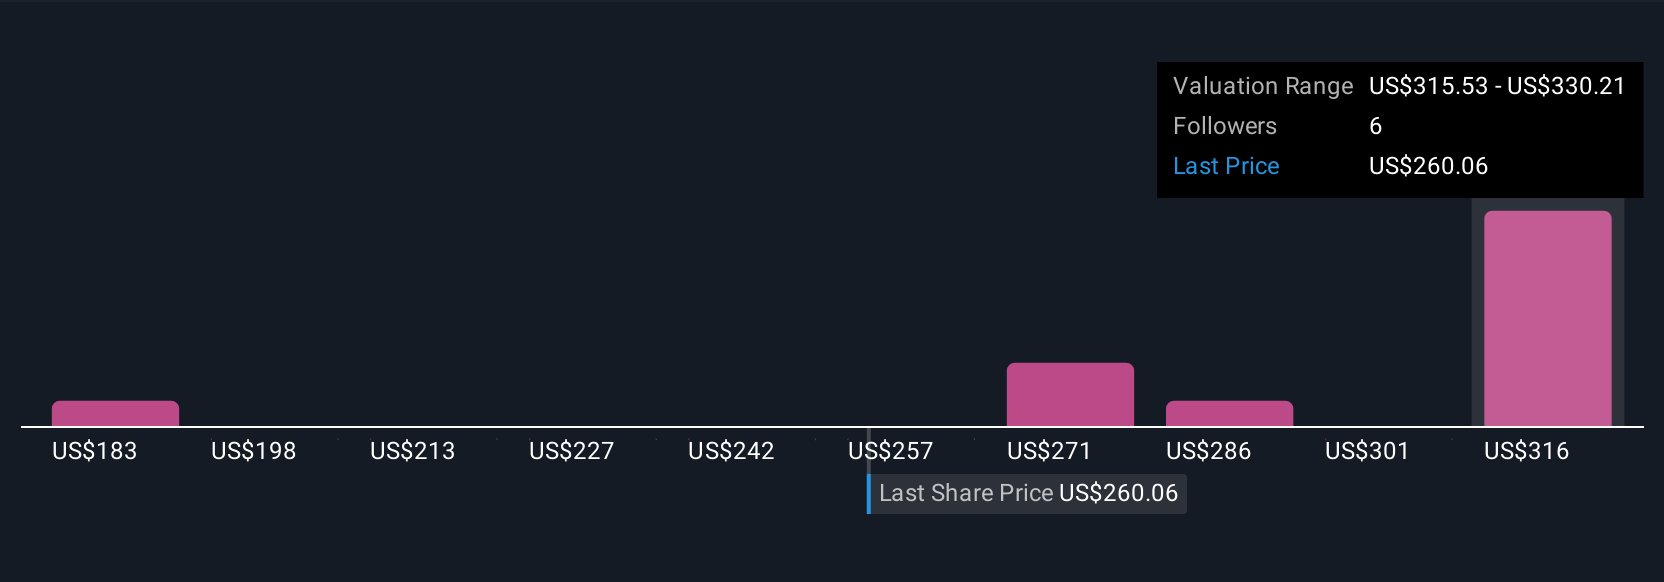
What makes Narratives especially powerful is how they update in real time as new news, earnings, or industry events emerge. This lets your story and your metrics always stay relevant. For Broadridge Financial Solutions, for example, some investors see a Fair Value as high as $305.00, reflecting optimism around digital and international expansion, while others are more cautious, setting it closer to $240.00 in light of headwinds and margin risks. Narratives empower you to choose, shape, and act on the story you believe in, with the facts and numbers to back you up.
Do you think there's more to the story for Broadridge Financial Solutions? Create your own Narrative to let the Community know!
This article by Simply Wall St is general in nature. We provide commentary based on historical data and analyst forecasts only using an unbiased methodology and our articles are not intended to be financial advice. It does not constitute a recommendation to buy or sell any stock, and does not take account of your objectives, or your financial situation. We aim to bring you long-term focused analysis driven by fundamental data. Note that our analysis may not factor in the latest price-sensitive company announcements or qualitative material. Simply Wall St has no position in any stocks mentioned.
Valuation is complex, but we're here to simplify it.
Discover if Broadridge Financial Solutions might be undervalued or overvalued with our detailed analysis, featuring fair value estimates, potential risks, dividends, insider trades, and its financial condition.
Access Free AnalysisHave feedback on this article? Concerned about the content? Get in touch with us directly. Alternatively, email editorial-team@simplywallst.com
About NYSE:BR
Broadridge Financial Solutions
Provides investor communications and technology-driven solutions for the financial services industry in the United States and internationally.
Solid track record established dividend payer.
Similar Companies
Market Insights

Advertisement
Community Narratives
The Next Phase of Energy Storage: How NeoVolta Is Tackling America’s Power Crunch
Fair Value US$7.50|30.4% undervalued
MA
Community Contributor
A formidable player in AI and enterprise computing.
Fair Value US$210.00|3.0% undervalued
CO
Community Contributor
IREN's Bold Moves in Sustainable Bitcoin Mining & AI Data Centers
Fair Value US$72.52|20.4% undervalued
BL
Community Contributor
Cooling the Champions: The Aussie Tech Behind F1's Victories
Fair Value AU$12.40|38.1% undervalued
TR
Community Contributor