- United States
- /
- Professional Services
- /
- NasdaqGS:VRSK
Investors in Verisk Analytics (NASDAQ:VRSK) have seen notable returns of 89% over the past five years


If you want to compound wealth in the stock market, you can do so by buying an index fund. But the truth is, you can make significant gains if you buy good quality businesses at the right price. For example, the Verisk Analytics, Inc. (NASDAQ:VRSK) share price is 83% higher than it was five years ago, which is more than the market average. We're also happy to report the stock is up a healthy 23% in the last year.
Let's take a look at the underlying fundamentals over the longer term, and see if they've been consistent with shareholders returns.
See our latest analysis for Verisk Analytics
In his essay The Superinvestors of Graham-and-Doddsville Warren Buffett described how share prices do not always rationally reflect the value of a business. By comparing earnings per share (EPS) and share price changes over time, we can get a feel for how investor attitudes to a company have morphed over time.
During five years of share price growth, Verisk Analytics achieved compound earnings per share (EPS) growth of 8.8% per year. This EPS growth is lower than the 13% average annual increase in the share price. So it's fair to assume the market has a higher opinion of the business than it did five years ago. That's not necessarily surprising considering the five-year track record of earnings growth. This favorable sentiment is reflected in its (fairly optimistic) P/E ratio of 49.87.
The company's earnings per share (over time) is depicted in the image below (click to see the exact numbers).
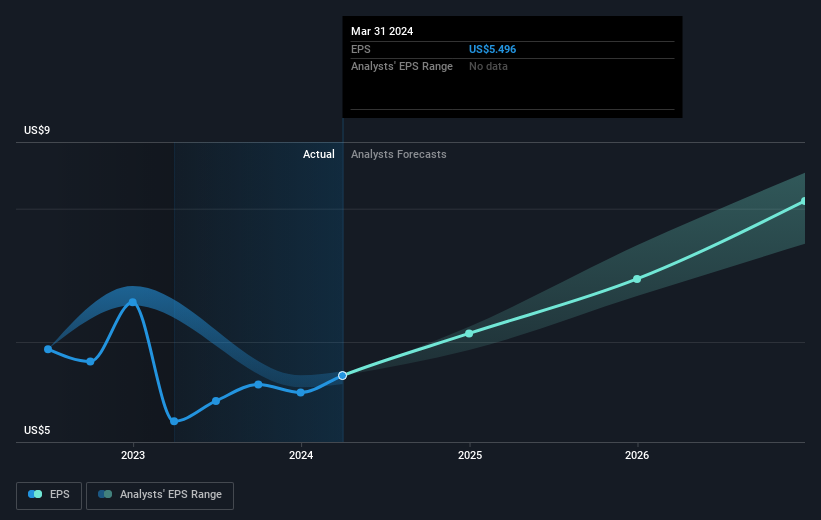
We know that Verisk Analytics has improved its bottom line lately, but is it going to grow revenue? This free report showing analyst revenue forecasts should help you figure out if the EPS growth can be sustained.
What About Dividends?
When looking at investment returns, it is important to consider the difference between total shareholder return (TSR) and share price return. The TSR incorporates the value of any spin-offs or discounted capital raisings, along with any dividends, based on the assumption that the dividends are reinvested. It's fair to say that the TSR gives a more complete picture for stocks that pay a dividend. In the case of Verisk Analytics, it has a TSR of 89% for the last 5 years. That exceeds its share price return that we previously mentioned. And there's no prize for guessing that the dividend payments largely explain the divergence!
A Different Perspective
Verisk Analytics provided a TSR of 23% over the year (including dividends). That's fairly close to the broader market return. Most would be happy with a gain, and it helps that the year's return is actually better than the average return over five years, which was 14%. Even if the share price growth slows down from here, there's a good chance that this is business worth watching in the long term. I find it very interesting to look at share price over the long term as a proxy for business performance. But to truly gain insight, we need to consider other information, too. Even so, be aware that Verisk Analytics is showing 1 warning sign in our investment analysis , you should know about...
If you like to buy stocks alongside management, then you might just love this free list of companies. (Hint: many of them are unnoticed AND have attractive valuation).
Please note, the market returns quoted in this article reflect the market weighted average returns of stocks that currently trade on American exchanges.
New: Manage All Your Stock Portfolios in One Place
We've created the ultimate portfolio companion for stock investors, and it's free.
• Connect an unlimited number of Portfolios and see your total in one currency
• Be alerted to new Warning Signs or Risks via email or mobile
• Track the Fair Value of your stocks
Have feedback on this article? Concerned about the content? Get in touch with us directly. Alternatively, email editorial-team (at) simplywallst.com.
This article by Simply Wall St is general in nature. We provide commentary based on historical data and analyst forecasts only using an unbiased methodology and our articles are not intended to be financial advice. It does not constitute a recommendation to buy or sell any stock, and does not take account of your objectives, or your financial situation. We aim to bring you long-term focused analysis driven by fundamental data. Note that our analysis may not factor in the latest price-sensitive company announcements or qualitative material. Simply Wall St has no position in any stocks mentioned.
Have feedback on this article? Concerned about the content? Get in touch with us directly. Alternatively, email editorial-team@simplywallst.com
About NasdaqGS:VRSK
Verisk Analytics
Provides data analytics and technology solutions to the insurance markets in the United States and internationally.
Solid track record with limited growth.
