Advertisement
- United States
- /
- Professional Services
- /
- NasdaqGS:SAIC
Reassessing Science Applications International After a 22% Slide in 2025

Simply Wall St
Reviewed by Bailey Pemberton
- If you are wondering whether Science Applications International is quietly turning into a value opportunity after a rough stretch in the market, you are not alone. This is exactly what we are going to unpack.
- The stock now trades around $87.53, up 2.1% over the last week but still down 4.2% over 30 days and 22.0% year to date, reflecting a market that has cooled on the name after a longer 1 year slide of 28.4%.
- In recent months, investor attention has been shaped more by shifting sentiment around government spending priorities and IT modernization budgets than by any single headline, as the company continues to position itself in high priority defense and federal tech programs. This backdrop helps explain why the share price has lagged even as the broader narrative around digital transformation and mission critical services remains firmly in focus.
- Despite that, the stock currently scores a strong 6/6 valuation score, suggesting it screens as undervalued across all our standard checks. Next, we will break down what those methods actually tell us, and then finish with a more powerful way to think about the company’s true worth.
Approach 1: Science Applications International Discounted Cash Flow (DCF) Analysis
A Discounted Cash Flow model takes the cash that a business is expected to generate in the future and discounts those projections back into today’s dollars, aiming to estimate what the entire company is worth right now.
For Science Applications International, the latest twelve month Free Cash Flow stands at about $449.7 million. Analysts only provide detailed forecasts for the next few years, but using those and then extrapolating further, Simply Wall St projects Free Cash Flow to be around $542.9 million in 10 years’ time. These cash flows are modeled using a 2 Stage Free Cash Flow to Equity approach, which allows for one growth phase followed by a more mature, slower growth period.
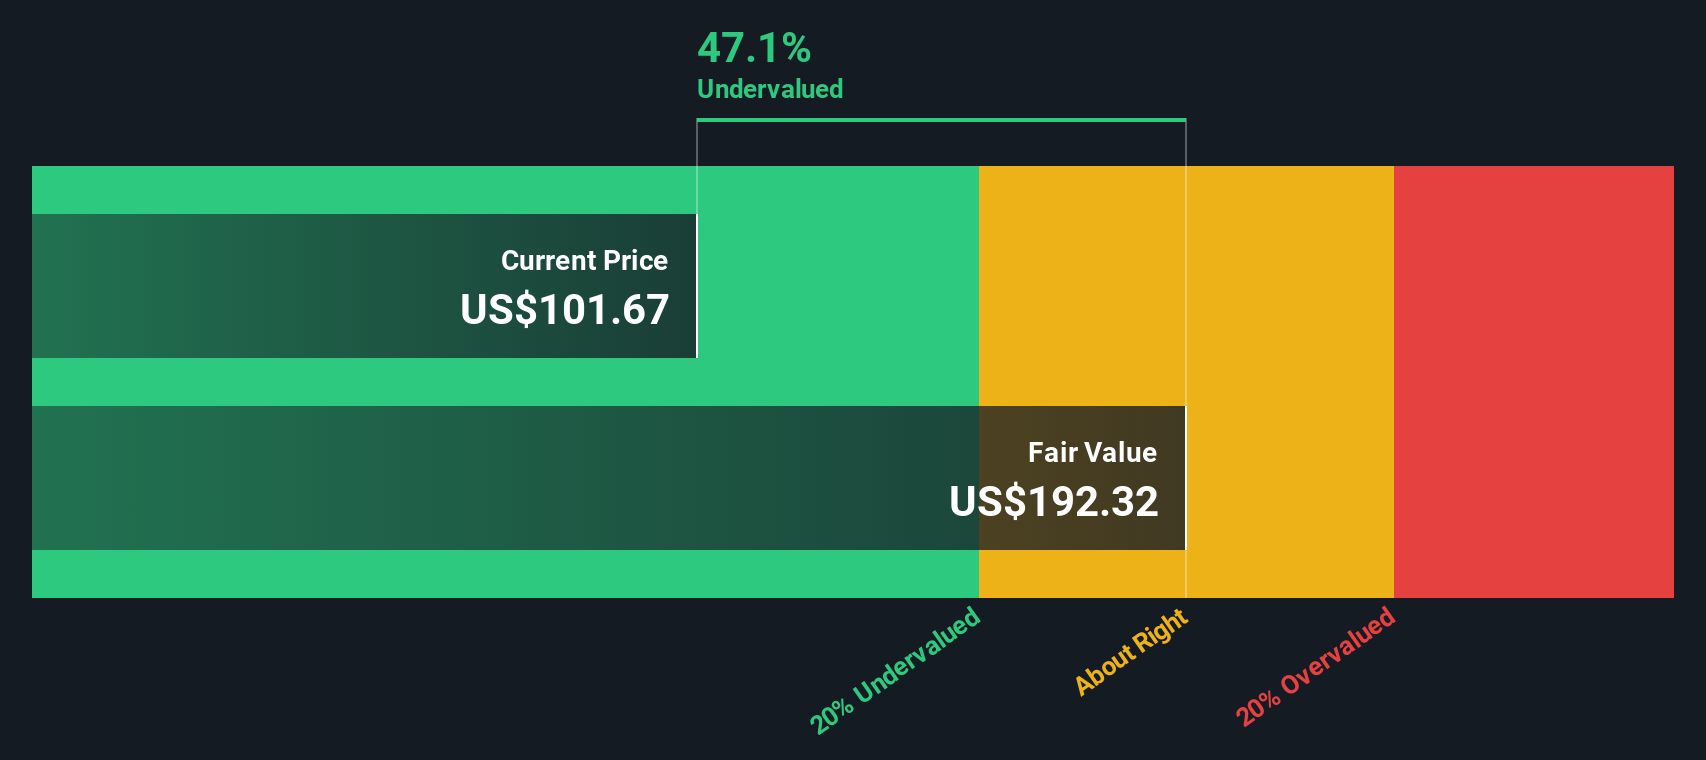
When all those future cash flows are discounted back, the model arrives at an estimated intrinsic value of roughly $187.56 per share. Compared with the current share price around $87.53, the DCF output suggests the stock is trading about 53.3% below this estimate of intrinsic value.
Result: UNDERVALUED
Our Discounted Cash Flow (DCF) analysis suggests Science Applications International is undervalued by 53.3%. Track this in your watchlist or portfolio, or discover 916 more undervalued stocks based on cash flows.
Approach 2: Science Applications International Price vs Earnings
For profitable, established businesses like Science Applications International, the Price to Earnings ratio is a straightforward way to gauge how much investors are willing to pay today for each dollar of current profit. What counts as a normal or fair PE largely reflects how quickly earnings are expected to grow and how risky those earnings are, with faster growth and lower risk typically justifying a higher multiple.
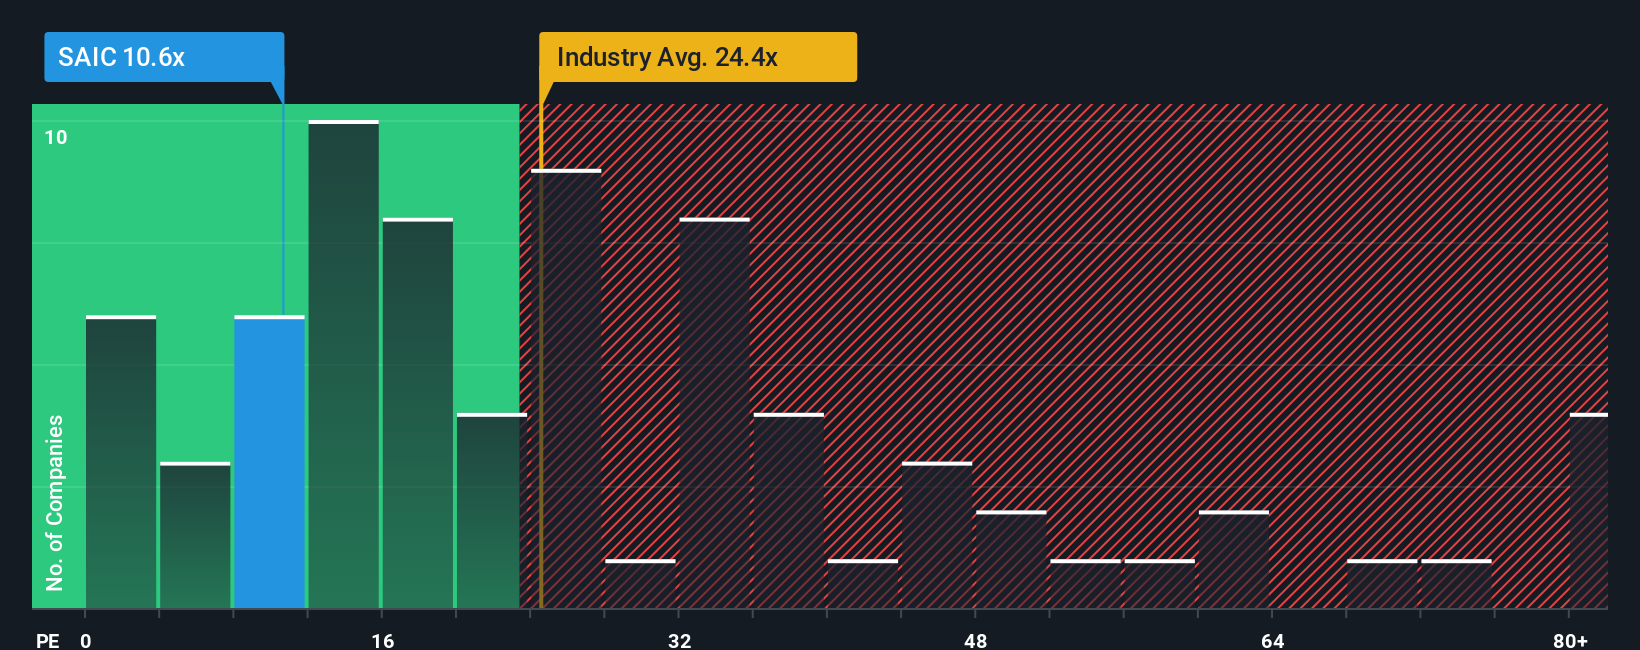
Science Applications International currently trades on a PE of about 10.10x, which is well below both the Professional Services industry average of roughly 24.78x and the broader peer group average around 22.94x. Simply Wall St also calculates a Fair Ratio of 18.88x, a proprietary estimate of what the PE should be after considering the company’s earnings growth outlook, profitability, risk profile, market cap and industry dynamics.
This Fair Ratio is more informative than a simple comparison to peers or the sector, because it adjusts for Science Applications International’s specific strengths and risks rather than assuming all companies deserve the same multiple. With the shares trading at 10.10x compared with a Fair Ratio of 18.88x, the stock screens as materially undervalued on an earnings basis.
Result: UNDERVALUED
PE ratios tell one story, but what if the real opportunity lies elsewhere? Discover 1443 companies where insiders are betting big on explosive growth.
Upgrade Your Decision Making: Choose your Science Applications International Narrative
Earlier we mentioned that there is an even better way to understand valuation, so let us introduce you to Narratives, a simple framework that lets you tell the story behind the numbers by linking your view of Science Applications International’s future revenues, earnings and margins to a concrete financial forecast and, ultimately, a fair value per share.
On Simply Wall St’s Community page, millions of investors use Narratives as an easy tool to spell out why they think a company will perform a certain way, translate that story into explicit forecasts, and then compare the resulting fair value to today’s price to decide whether it looks like a buy, hold or sell.
Narratives are dynamic, automatically updating when fresh information such as earnings, new contracts or guidance changes comes in, so your valuation view can evolve with the facts rather than staying stuck in a one-off model.
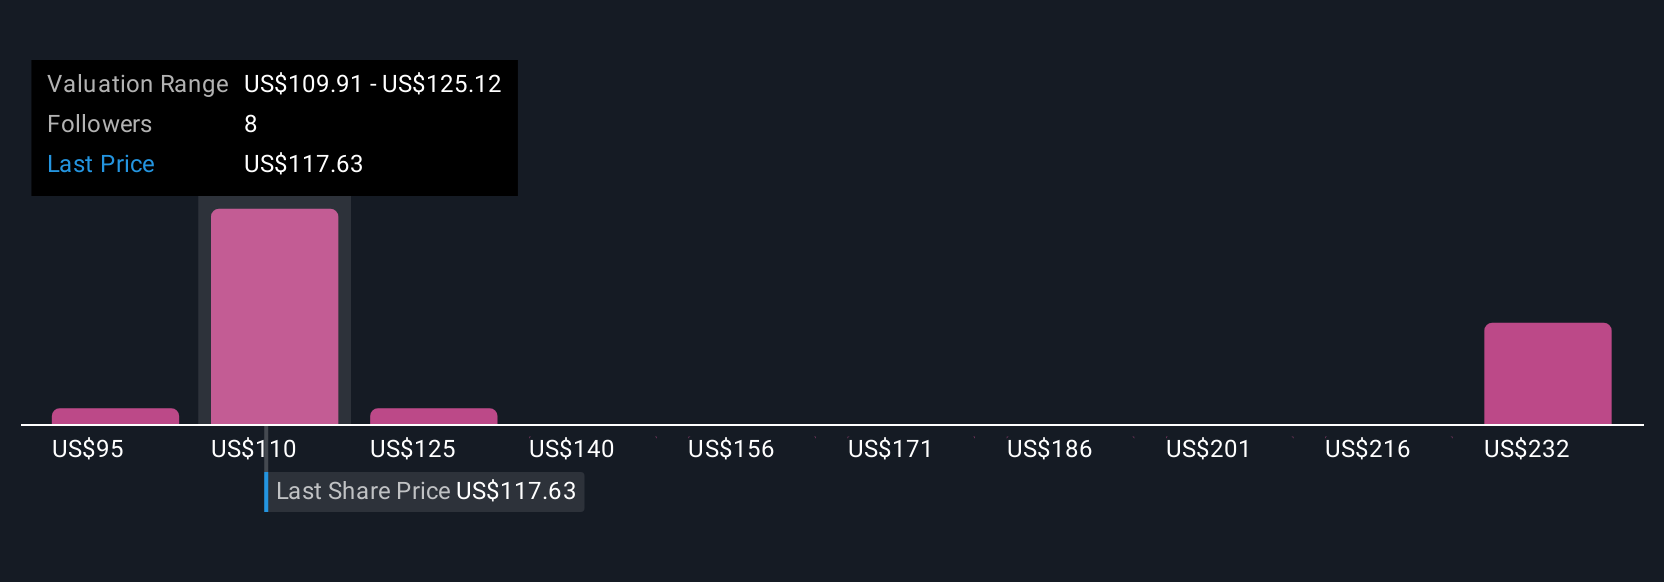
For example, one Science Applications International Narrative might assume strong execution in digital modernization and assign a fair value near $130, while a more cautious view focused on budget headwinds and competitive pressure could land closer to $91. This shows how different, clearly stated perspectives lead to different but transparent estimates of worth.
Do you think there's more to the story for Science Applications International? Head over to our Community to see what others are saying!
This article by Simply Wall St is general in nature. We provide commentary based on historical data and analyst forecasts only using an unbiased methodology and our articles are not intended to be financial advice. It does not constitute a recommendation to buy or sell any stock, and does not take account of your objectives, or your financial situation. We aim to bring you long-term focused analysis driven by fundamental data. Note that our analysis may not factor in the latest price-sensitive company announcements or qualitative material. Simply Wall St has no position in any stocks mentioned.
New: Manage All Your Stock Portfolios in One Place
We've created the ultimate portfolio companion for stock investors, and it's free.
• Connect an unlimited number of Portfolios and see your total in one currency
• Be alerted to new Warning Signs or Risks via email or mobile
• Track the Fair Value of your stocks
Have feedback on this article? Concerned about the content? Get in touch with us directly. Alternatively, email editorial-team@simplywallst.com
About NasdaqGS:SAIC
Science Applications International
Provides technical, engineering, and enterprise information technology (IT) services in the United States.
Very undervalued with solid track record and pays a dividend.
Similar Companies
Market Insights

Advertisement
Weekly Picks
RO


RockeTeller on Santacruz Silver Mining ·
Crazy Undervalued 42 Baggers Silver Play (Active & Running Mine)
Fair Value:CA$8696.4% undervalued
41 followersusers have followed this narrative
6 commentsusers have commented on this narrative
13 likesusers have liked this narrative
RO


Robbo on Fiducian Group ·
Fiducian: Compliance Clouds or Value Opportunity?
Fair Value:AU$123.8% undervalued
5 followersusers have followed this narrative
0 commentsusers have commented on this narrative
0 likesusers have liked this narrative
WO

woodworthfund on Willamette Valley Vineyards ·
Willamette Valley Vineyards (WVVI): Not-So-Great Value
Fair Value:US$244.5% overvalued
7 followersusers have followed this narrative
0 commentsusers have commented on this narrative
1 likeusers have liked this narrative
Recently Updated Narratives
SC

scm on Text ·
TXT will see revenue grow 26% with a profit margin boost of almost 40%
Fair Value:zł8048.3% undervalued
2 followersusers have followed this narrative
0 commentsusers have commented on this narrative
0 likesusers have liked this narrative
VL

Vladislav on Galleon Gold ·
Significantly undervalued gold explorer in Timmins, finally getting traction
Fair Value:CA$482.9% undervalued
2 followersusers have followed this narrative
0 commentsusers have commented on this narrative
0 likesusers have liked this narrative
FU

FundamentallySarcastic on Credit Corp Group ·
Moderation and Stabilisation: HOLD: Fair Price based on a 4-year Cycle is $12.08
Fair Value:AU$12.6411.8% overvalued
3 followersusers have followed this narrative
0 commentsusers have commented on this narrative
0 likesusers have liked this narrative
Popular Narratives
TH


TheWallstreetKing on MicroVision ·
MicroVision will explode future revenue by 380.37% with a vision towards success
Fair Value:US$6098.5% undervalued
116 followersusers have followed this narrative
11 commentsusers have commented on this narrative
22 likesusers have liked this narrative
AN


AnalystConsensusTarget on NVIDIA ·
NVDA: Expanding AI Demand Will Drive Major Data Center Investments Through 2026
Fair Value:US$250.3928.3% undervalued
955 followersusers have followed this narrative
6 commentsusers have commented on this narrative
25 likesusers have liked this narrative
OS


oscargarcia on Alphabet ·
The company that turned a verb into a global necessity and basically runs the modern internet, digital ads, smartphones, maps, and AI.
Fair Value:US$3406.0% undervalued
147 followersusers have followed this narrative
6 commentsusers have commented on this narrative
18 likesusers have liked this narrative

