- United States
- /
- Professional Services
- /
- NasdaqGS:KELY.A
Estimating The Intrinsic Value Of Kelly Services, Inc. (NASDAQ:KELY.A)


Key Insights
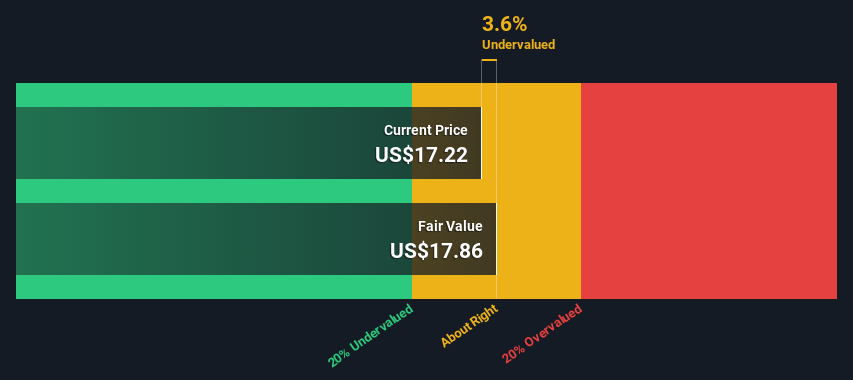
- The projected fair value for Kelly Services is US$17.86 based on 2 Stage Free Cash Flow to Equity
- With US$17.22 share price, Kelly Services appears to be trading close to its estimated fair value
- Our fair value estimate is 30% lower than Kelly Services' analyst price target of US$25.33
How far off is Kelly Services, Inc. (NASDAQ:KELY.A) from its intrinsic value? Using the most recent financial data, we'll take a look at whether the stock is fairly priced by projecting its future cash flows and then discounting them to today's value. We will take advantage of the Discounted Cash Flow (DCF) model for this purpose. Before you think you won't be able to understand it, just read on! It's actually much less complex than you'd imagine.
We would caution that there are many ways of valuing a company and, like the DCF, each technique has advantages and disadvantages in certain scenarios. If you still have some burning questions about this type of valuation, take a look at the Simply Wall St analysis model.
Check out our latest analysis for Kelly Services
The Calculation
We're using the 2-stage growth model, which simply means we take in account two stages of company's growth. In the initial period the company may have a higher growth rate and the second stage is usually assumed to have a stable growth rate. To start off with, we need to estimate the next ten years of cash flows. Where possible we use analyst estimates, but when these aren't available we extrapolate the previous free cash flow (FCF) from the last estimate or reported value. We assume companies with shrinking free cash flow will slow their rate of shrinkage, and that companies with growing free cash flow will see their growth rate slow, over this period. We do this to reflect that growth tends to slow more in the early years than it does in later years.
Generally we assume that a dollar today is more valuable than a dollar in the future, so we need to discount the sum of these future cash flows to arrive at a present value estimate:
10-year free cash flow (FCF) estimate
| 2024 | 2025 | 2026 | 2027 | 2028 | 2029 | 2030 | 2031 | 2032 | 2033 | |
| Levered FCF ($, Millions) | US$36.6m | US$34.6m | US$33.5m | US$32.9m | US$32.8m | US$32.9m | US$33.2m | US$33.6m | US$34.1m | US$34.7m |
| Growth Rate Estimate Source | Analyst x1 | Est @ -5.46% | Est @ -3.18% | Est @ -1.58% | Est @ -0.46% | Est @ 0.32% | Est @ 0.87% | Est @ 1.25% | Est @ 1.52% | Est @ 1.71% |
| Present Value ($, Millions) Discounted @ 6.8% | US$34.2 | US$30.3 | US$27.5 | US$25.3 | US$23.6 | US$22.1 | US$20.9 | US$19.8 | US$18.8 | US$17.9 |
("Est" = FCF growth rate estimated by Simply Wall St)
Present Value of 10-year Cash Flow (PVCF) = US$240m
We now need to calculate the Terminal Value, which accounts for all the future cash flows after this ten year period. The Gordon Growth formula is used to calculate Terminal Value at a future annual growth rate equal to the 5-year average of the 10-year government bond yield of 2.2%. We discount the terminal cash flows to today's value at a cost of equity of 6.8%.
Terminal Value (TV)= FCF2033 × (1 + g) ÷ (r – g) = US$35m× (1 + 2.2%) ÷ (6.8%– 2.2%) = US$758m
Present Value of Terminal Value (PVTV)= TV / (1 + r)10= US$758m÷ ( 1 + 6.8%)10= US$392m
The total value, or equity value, is then the sum of the present value of the future cash flows, which in this case is US$632m. The last step is to then divide the equity value by the number of shares outstanding. Compared to the current share price of US$17.2, the company appears about fair value at a 3.6% discount to where the stock price trades currently. Remember though, that this is just an approximate valuation, and like any complex formula - garbage in, garbage out.
Important Assumptions
Now the most important inputs to a discounted cash flow are the discount rate, and of course, the actual cash flows. If you don't agree with these result, have a go at the calculation yourself and play with the assumptions. The DCF also does not consider the possible cyclicality of an industry, or a company's future capital requirements, so it does not give a full picture of a company's potential performance. Given that we are looking at Kelly Services as potential shareholders, the cost of equity is used as the discount rate, rather than the cost of capital (or weighted average cost of capital, WACC) which accounts for debt. In this calculation we've used 6.8%, which is based on a levered beta of 0.935. Beta is a measure of a stock's volatility, compared to the market as a whole. We get our beta from the industry average beta of globally comparable companies, with an imposed limit between 0.8 and 2.0, which is a reasonable range for a stable business.
SWOT Analysis for Kelly Services
- Currently debt free.
- Earnings declined over the past year.
- Dividend is low compared to the top 25% of dividend payers in the Professional Services market.
- Annual earnings are forecast to grow faster than the American market.
- Good value based on P/S ratio and estimated fair value.
- Dividends are not covered by earnings.
- Annual revenue is forecast to grow slower than the American market.
Next Steps:
Valuation is only one side of the coin in terms of building your investment thesis, and it shouldn't be the only metric you look at when researching a company. The DCF model is not a perfect stock valuation tool. Preferably you'd apply different cases and assumptions and see how they would impact the company's valuation. For instance, if the terminal value growth rate is adjusted slightly, it can dramatically alter the overall result. For Kelly Services, we've compiled three essential aspects you should further research:
- Risks: As an example, we've found 4 warning signs for Kelly Services that you need to consider before investing here.
- Management:Have insiders been ramping up their shares to take advantage of the market's sentiment for KELY.A's future outlook? Check out our management and board analysis with insights on CEO compensation and governance factors.
- Other Solid Businesses: Low debt, high returns on equity and good past performance are fundamental to a strong business. Why not explore our interactive list of stocks with solid business fundamentals to see if there are other companies you may not have considered!
PS. Simply Wall St updates its DCF calculation for every American stock every day, so if you want to find the intrinsic value of any other stock just search here.
Valuation is complex, but we're here to simplify it.
Discover if Kelly Services might be undervalued or overvalued with our detailed analysis, featuring fair value estimates, potential risks, dividends, insider trades, and its financial condition.
Access Free AnalysisHave feedback on this article? Concerned about the content? Get in touch with us directly. Alternatively, email editorial-team (at) simplywallst.com.
This article by Simply Wall St is general in nature. We provide commentary based on historical data and analyst forecasts only using an unbiased methodology and our articles are not intended to be financial advice. It does not constitute a recommendation to buy or sell any stock, and does not take account of your objectives, or your financial situation. We aim to bring you long-term focused analysis driven by fundamental data. Note that our analysis may not factor in the latest price-sensitive company announcements or qualitative material. Simply Wall St has no position in any stocks mentioned.
About NasdaqGS:KELY.A
Very undervalued with adequate balance sheet.
Similar Companies
Market Insights

Community Narratives

