- United States
- /
- Professional Services
- /
- NasdaqCM:HQI
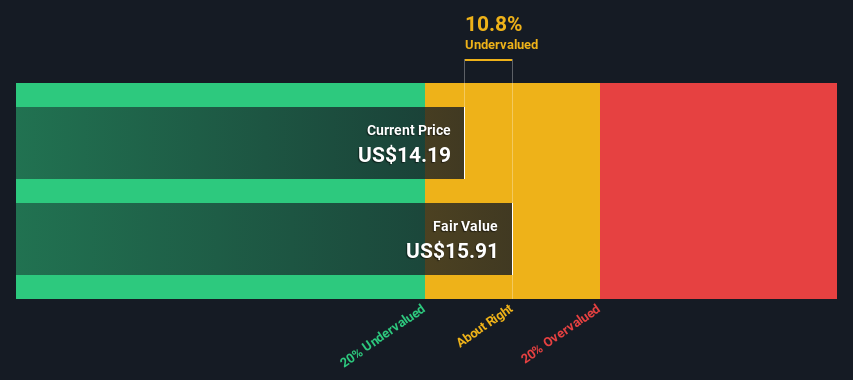
Estimating The Intrinsic Value Of HireQuest, Inc. (NASDAQ:HQI)


Key Insights
- Using the 2 Stage Free Cash Flow to Equity, HireQuest fair value estimate is US$15.91
- With US$14.19 share price, HireQuest appears to be trading close to its estimated fair value
- HireQuest's peers are currently trading at a premium of 18% on average
Today we will run through one way of estimating the intrinsic value of HireQuest, Inc. (NASDAQ:HQI) by projecting its future cash flows and then discounting them to today's value. We will take advantage of the Discounted Cash Flow (DCF) model for this purpose. Don't get put off by the jargon, the math behind it is actually quite straightforward.
Companies can be valued in a lot of ways, so we would point out that a DCF is not perfect for every situation. If you want to learn more about discounted cash flow, the rationale behind this calculation can be read in detail in the Simply Wall St analysis model.
View our latest analysis for HireQuest
Crunching The Numbers
We're using the 2-stage growth model, which simply means we take in account two stages of company's growth. In the initial period the company may have a higher growth rate and the second stage is usually assumed to have a stable growth rate. To start off with, we need to estimate the next ten years of cash flows. Seeing as no analyst estimates of free cash flow are available to us, we have extrapolate the previous free cash flow (FCF) from the company's last reported value. We assume companies with shrinking free cash flow will slow their rate of shrinkage, and that companies with growing free cash flow will see their growth rate slow, over this period. We do this to reflect that growth tends to slow more in the early years than it does in later years.
A DCF is all about the idea that a dollar in the future is less valuable than a dollar today, so we need to discount the sum of these future cash flows to arrive at a present value estimate:
10-year free cash flow (FCF) forecast
| 2025 | 2026 | 2027 | 2028 | 2029 | 2030 | 2031 | 2032 | 2033 | 2034 | |
| Levered FCF ($, Millions) | US$10.5m | US$10.2m | US$10.0m | US$10.0m | US$10.1m | US$10.2m | US$10.4m | US$10.6m | US$10.9m | US$11.1m |
| Growth Rate Estimate Source | Est @ -5.60% | Est @ -3.10% | Est @ -1.34% | Est @ -0.12% | Est @ 0.74% | Est @ 1.35% | Est @ 1.77% | Est @ 2.06% | Est @ 2.27% | Est @ 2.41% |
| Present Value ($, Millions) Discounted @ 6.7% | US$9.8 | US$8.9 | US$8.2 | US$7.7 | US$7.3 | US$6.9 | US$6.6 | US$6.3 | US$6.0 | US$5.8 |
("Est" = FCF growth rate estimated by Simply Wall St)
Present Value of 10-year Cash Flow (PVCF) = US$74m
The second stage is also known as Terminal Value, this is the business's cash flow after the first stage. For a number of reasons a very conservative growth rate is used that cannot exceed that of a country's GDP growth. In this case we have used the 5-year average of the 10-year government bond yield (2.8%) to estimate future growth. In the same way as with the 10-year 'growth' period, we discount future cash flows to today's value, using a cost of equity of 6.7%.
Terminal Value (TV)= FCF2034 × (1 + g) ÷ (r – g) = US$11m× (1 + 2.8%) ÷ (6.7%– 2.8%) = US$286m
Present Value of Terminal Value (PVTV)= TV / (1 + r)10= US$286m÷ ( 1 + 6.7%)10= US$149m
The total value is the sum of cash flows for the next ten years plus the discounted terminal value, which results in the Total Equity Value, which in this case is US$223m. The last step is to then divide the equity value by the number of shares outstanding. Compared to the current share price of US$14.2, the company appears about fair value at a 11% discount to where the stock price trades currently. Remember though, that this is just an approximate valuation, and like any complex formula - garbage in, garbage out.
Important Assumptions
The calculation above is very dependent on two assumptions. The first is the discount rate and the other is the cash flows. You don't have to agree with these inputs, I recommend redoing the calculations yourself and playing with them. The DCF also does not consider the possible cyclicality of an industry, or a company's future capital requirements, so it does not give a full picture of a company's potential performance. Given that we are looking at HireQuest as potential shareholders, the cost of equity is used as the discount rate, rather than the cost of capital (or weighted average cost of capital, WACC) which accounts for debt. In this calculation we've used 6.7%, which is based on a levered beta of 0.921. Beta is a measure of a stock's volatility, compared to the market as a whole. We get our beta from the industry average beta of globally comparable companies, with an imposed limit between 0.8 and 2.0, which is a reasonable range for a stable business.
SWOT Analysis for HireQuest
- Debt is not viewed as a risk.
- Earnings declined over the past year.
- Dividend is low compared to the top 25% of dividend payers in the Professional Services market.
- Annual earnings are forecast to grow faster than the American market.
- Current share price is below our estimate of fair value.
- Dividends are not covered by earnings.
Moving On:
Although the valuation of a company is important, it is only one of many factors that you need to assess for a company. DCF models are not the be-all and end-all of investment valuation. Preferably you'd apply different cases and assumptions and see how they would impact the company's valuation. For instance, if the terminal value growth rate is adjusted slightly, it can dramatically alter the overall result. For HireQuest, we've compiled three relevant factors you should assess:
- Risks: For instance, we've identified 3 warning signs for HireQuest that you should be aware of.
- Future Earnings: How does HQI's growth rate compare to its peers and the wider market? Dig deeper into the analyst consensus number for the upcoming years by interacting with our free analyst growth expectation chart.
- Other Solid Businesses: Low debt, high returns on equity and good past performance are fundamental to a strong business. Why not explore our interactive list of stocks with solid business fundamentals to see if there are other companies you may not have considered!
PS. The Simply Wall St app conducts a discounted cash flow valuation for every stock on the NASDAQCM every day. If you want to find the calculation for other stocks just search here.
If you're looking to trade HireQuest, open an account with the lowest-cost platform trusted by professionals, Interactive Brokers.
With clients in over 200 countries and territories, and access to 160 markets, IBKR lets you trade stocks, options, futures, forex, bonds and funds from a single integrated account.
Enjoy no hidden fees, no account minimums, and FX conversion rates as low as 0.03%, far better than what most brokers offer.
Sponsored ContentValuation is complex, but we're here to simplify it.
Discover if HireQuest might be undervalued or overvalued with our detailed analysis, featuring fair value estimates, potential risks, dividends, insider trades, and its financial condition.
Access Free AnalysisHave feedback on this article? Concerned about the content? Get in touch with us directly. Alternatively, email editorial-team (at) simplywallst.com.
This article by Simply Wall St is general in nature. We provide commentary based on historical data and analyst forecasts only using an unbiased methodology and our articles are not intended to be financial advice. It does not constitute a recommendation to buy or sell any stock, and does not take account of your objectives, or your financial situation. We aim to bring you long-term focused analysis driven by fundamental data. Note that our analysis may not factor in the latest price-sensitive company announcements or qualitative material. Simply Wall St has no position in any stocks mentioned.
About NasdaqCM:HQI
HireQuest
Engages in the provision of temporary staffing services in the United States.
Excellent balance sheet second-rate dividend payer.
Similar Companies
Market Insights

Community Narratives

