
Advertisement
- United States
- /
- Commercial Services
- /
- NasdaqCM:AREB
American Rebel Holdings, Inc.'s (NASDAQ:AREB) Shares Leap 67% Yet They're Still Not Telling The Full Story

The American Rebel Holdings, Inc. (NASDAQ:AREB) share price has done very well over the last month, posting an excellent gain of 67%. Looking further back, the 14% rise over the last twelve months isn't too bad notwithstanding the strength over the last 30 days.
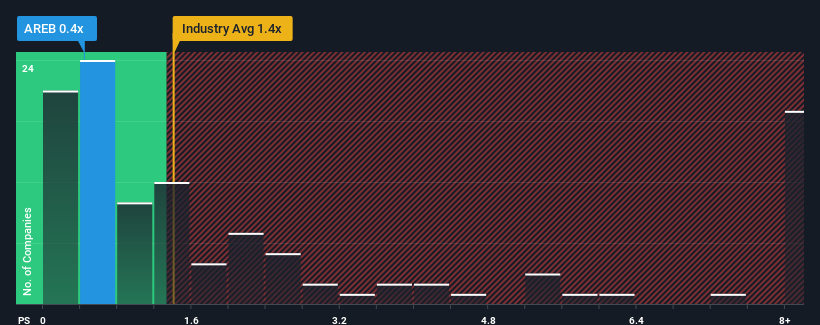
Although its price has surged higher, American Rebel Holdings' price-to-sales (or "P/S") ratio of 0.4x might still make it look like a buy right now compared to the Commercial Services industry in the United States, where around half of the companies have P/S ratios above 1.4x and even P/S above 4x are quite common. Nonetheless, we'd need to dig a little deeper to determine if there is a rational basis for the reduced P/S.
See our latest analysis for American Rebel Holdings
How American Rebel Holdings Has Been Performing
For example, consider that American Rebel Holdings' financial performance has been poor lately as its revenue has been in decline. It might be that many expect the disappointing revenue performance to continue or accelerate, which has repressed the P/S. Those who are bullish on American Rebel Holdings will be hoping that this isn't the case so that they can pick up the stock at a lower valuation.
Want the full picture on earnings, revenue and cash flow for the company? Then our free report on American Rebel Holdings will help you shine a light on its historical performance.What Are Revenue Growth Metrics Telling Us About The Low P/S?
There's an inherent assumption that a company should underperform the industry for P/S ratios like American Rebel Holdings' to be considered reasonable.
Taking a look back first, the company's revenue growth last year wasn't something to get excited about as it posted a disappointing decline of 3.6%. The latest three year period has seen an incredible overall rise in revenue, a stark contrast to the last 12 months. Therefore, it's fair to say the revenue growth recently has been superb for the company, but investors will want to ask why it is now in decline.
Comparing that to the industry, which is only predicted to deliver 7.3% growth in the next 12 months, the company's momentum is stronger based on recent medium-term annualised revenue results.
With this in mind, we find it intriguing that American Rebel Holdings' P/S isn't as high compared to that of its industry peers. Apparently some shareholders believe the recent performance has exceeded its limits and have been accepting significantly lower selling prices.
What Does American Rebel Holdings' P/S Mean For Investors?
The latest share price surge wasn't enough to lift American Rebel Holdings' P/S close to the industry median. Using the price-to-sales ratio alone to determine if you should sell your stock isn't sensible, however it can be a practical guide to the company's future prospects.
Our examination of American Rebel Holdings revealed its three-year revenue trends aren't boosting its P/S anywhere near as much as we would have predicted, given they look better than current industry expectations. When we see robust revenue growth that outpaces the industry, we presume that there are notable underlying risks to the company's future performance, which is exerting downward pressure on the P/S ratio. It appears many are indeed anticipating revenue instability, because the persistence of these recent medium-term conditions would normally provide a boost to the share price.
Before you settle on your opinion, we've discovered 4 warning signs for American Rebel Holdings that you should be aware of.
If you're unsure about the strength of American Rebel Holdings' business, why not explore our interactive list of stocks with solid business fundamentals for some other companies you may have missed.
New: Manage All Your Stock Portfolios in One Place
We've created the ultimate portfolio companion for stock investors, and it's free.
• Connect an unlimited number of Portfolios and see your total in one currency
• Be alerted to new Warning Signs or Risks via email or mobile
• Track the Fair Value of your stocks
Have feedback on this article? Concerned about the content? Get in touch with us directly. Alternatively, email editorial-team (at) simplywallst.com.
This article by Simply Wall St is general in nature. We provide commentary based on historical data and analyst forecasts only using an unbiased methodology and our articles are not intended to be financial advice. It does not constitute a recommendation to buy or sell any stock, and does not take account of your objectives, or your financial situation. We aim to bring you long-term focused analysis driven by fundamental data. Note that our analysis may not factor in the latest price-sensitive company announcements or qualitative material. Simply Wall St has no position in any stocks mentioned.
About NasdaqCM:AREB
American Rebel Holdings
Designs, manufactures, and markets branded safes, and personal security and self-defense products.
Moderate and slightly overvalued.
Market Insights

Advertisement
Community Narratives

Apple: A Dying Star with an Overpriced Valuation
Fair Value US$177.34|19.1% overvalued
IN
Community Contributor
Avino a case for USD$20 per share within 5 years (assuming $3,500 gold, $100 silver and $4 copper).
Fair Value CA$26.79|86.0% undervalued
AG
Community Contributor
Riding the Defense Boom RENK Sees Revenue Climb at 15% CAGR by FY 2029
Fair Value €69.87|14.3% undervalued
CH
Community Contributor